Yield Curve Inverted, but Not Yet Signaling a Recession

The yield curve is a closely watched harbinger of recessions. Inverted yield curves have previously preceded most recessions over the past 50 years. 

Charles Rotblut leads a class in AAII's new Essential Investing Video Course. Go to https://www.aaii.com/ves for more information and to subscribe.

The yield curve is a closely watched harbinger of recessions. Inverted yield curves have previously preceded most recessions over the past 50 years. As we sent this issue to the printer, the yield curve was exhibiting some signs of inversion.

Inversion occurs when short-term interest rates are higher than long-term interest rates.

Normally, yields on longer-dated bonds are higher than those on shorter-dated bonds. Investors demand higher yields as compensation for locking their money up for longer periods of time. This results in an upward sloping yield curve, which is what we saw during the first quarter of 2022.

When a recession is anticipated, yields on long-term bonds can fall below those of short-term yields. This leads to the yield curve becoming inverted. As of mid-June, the yield curve was inverting, with yields on the two-year note (3.13%) higher than yields on the five-year note (3.05%) and the 10-year note (2.93%).
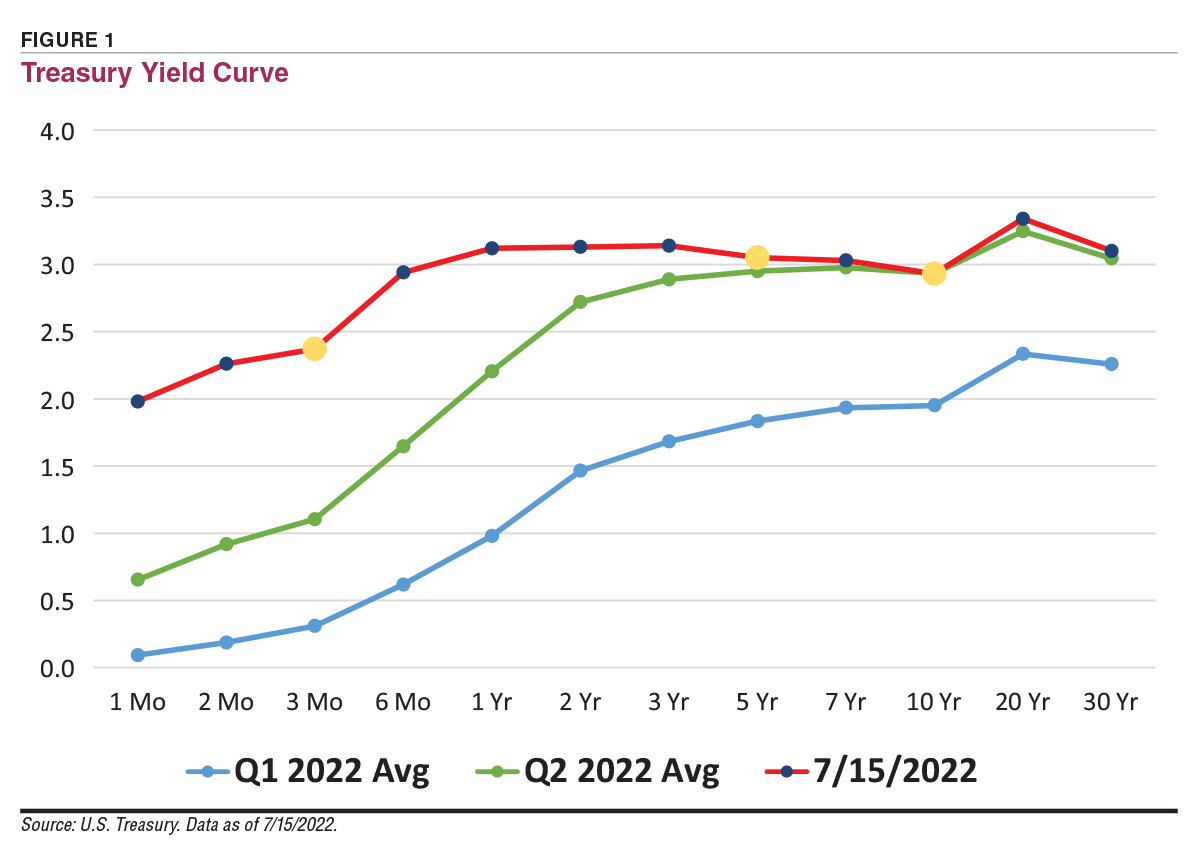
FIGURE 1  Treasury Yield Curve

Duke University professor Campbell Harvey, who first identified inverted yield curves as preceding recessions, suggests comparing the three-month Treasury bill yield with the five- or 10-year Treasury note yield. (Harvey looks at the average yield over an entire quarter, not just a day.) On this basis, the yield curve has yet to signal a recession (2.37% versus 3.05% and 2.93%, respectively).

Even if the current yield curve has yet to meet Harvey’s definition for signaling a forthcoming recession, flat yield curves do suggest a forthcoming period of slower economic growth. A flat curve occurs when short-term rates are close to, but not below, long-term interest rates. For more on the yield curve, see this month’s online exclusive Investor Professor column, “What Is the Yield Curve?” 

Discussion

JOHN S from CA posted over 3 years ago:

I have not figured out how I lost money on shortterm treasuries in my ETF this year


F G from CA posted over 3 years ago:

It was inevitable. Yields started at next to nothing. As they rose, prices on the ETF holding had to fall to produce yields that were competitive with the new issues. You will probably continue losing until the Fed stops raising.


BARRY J from TX posted over 3 years ago:

Thank you Charles for the quick teach. The last sentence is the key: “Understanding the yield curve helps you to make more certain decisions about the uncertain future.” Yield curve information is free public information. You do not need to worry about being the first one to know the current yield curve status … unless you are a bond trader with a sizable portfolio. But you do need to listen -- and understand-- what the yield curve is telling you. The Fed has two “dueling” mandates: maintain (1) price stability and (2) maximum sustainable employment. In 2022, that creates a “Hobson’s Choice” for the Fed. Inflation has risen to levels not seen in 30 years. At around 8%, it is 4 times higher than the Fed goal of 2%. The Fed is raising interest rates aggressively to lower inflation. High inflation has depressed economic growth (GDP) in 2022 to around 0 year to date. The Fed has signaled it will increase interest rates until it brings inflation under control (back to 2%) … even if it leads to a recession (0 or negative economic growth AND higher unemployment.). You should take that kind of talk seriously. Recession is a bad thing, Martha. Inflation and rising interest rates will replicate the exact conditions that preceded the 2007 Global Financial Crisis, the 200 dot com bubble, and the 1981-1983 recession. In 2022, paying attention to how the yield curve is TRENDING is a very important signal of how the “smart money” in the market thinks the Fed will react to conflicting economic and market signals. In August, some of the key economic indicators (KEI) the Fed follows closely (Core CPI and Core CPE and the low employment rate around 4%) that underpin strong economic performance (GDP>0) might be leveling off because business and consumer demand may be softening due to continued rising inflation. Some consider these data trends as indicating a recession is on the horizon. This put the Fed in a pickle. It has vowed to continue rapid interest rates increases to abate inflation ... and at the same time … the Fed policy choices contribute to the probability of recession which will bring higher unemployment. In the Air Force we called that booboo “flying level into rising terrain.” That’s a really bad thing, Martha. When the UST yield curve inverts (ST rates> LT rates), ”smart money” market players pay higher interest for investing using borrowed more costly money and they cut their big bets back. Demand goes down. Prices go down. If you are not listening to the yield curve trends, you will be the last one to know WHEN the “smart money” is ready to pass the dice to YOU. As my boss at Xerox told me when he sent me to do business deals, “If you look around the table and you don’t know who “the mark” is (who’s paying for the deal), … it’s you.


You need to log in as a registered AAII user before commenting.
Create an account

Log In

Get your free copy of our special report analyzing the tech stocks most likely to outperform the market.

Download the FREE Report Here:
