


Related
Investor Professor
Given recent interest rate increases, many bonds and preferred stocks are now offering attractive yields.

Like the novel “A Tale of Two Cities,” the rising interest rate environment of 2022 has led to both “the worst of times” and “the best of times” for fixed-income investors. Sharp increases in interest rates have lowered prices on fixed-income investments such as bonds and preferred stocks, resulting in sizable paper losses for many. On the other hand, higher rates have also led to excellent investment opportunities to “lock in” high yields with potential for capital gains.
To best evaluate the risks and opportunities in a rising interest rate environment, you need to understand the principles of duration (interest rate risk), credit risk and the yield curve. We can then boil down fixed-income investing to price-comparison shopping, given the risks you are willing to accept.
This article assumes some prior knowledge of bonds and preferred stocks (aka preferreds).
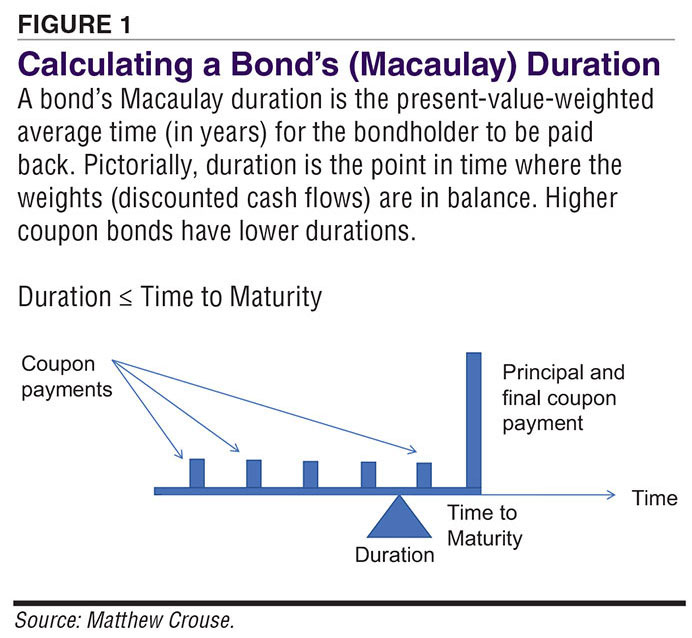
Duration is both a measure of time (years) and of interest rate risk. The Macaulay duration gives an intuitive feel for what duration is: the average time, weighted by cash flow sizes, of the payments received from a fixed-income investment. Figure 1 illustrates this.
A bond’s cash flows consist of periodic interest payments (coupon payments) and the repayment of principal. With the principal being the dominant cash flow, Macaulay duration is primarily determined by the maturity date of a bond—the date when the principal gets paid back.
Bonds with longer maturities tend to have longer durations than bonds with shorter maturities. For bonds with similar maturities, duration will be lower for the bond with the larger coupon.
Duration as a measure of interest rate risk (aka modified duration) provides the sensitivity of a bond’s price to a change in the interest rate. The formula is:
Bond price change ≈ – Duration × (Interest rate change)
For example, a bond with a modified duration of seven years will incur a price decrease of roughly 7% for a 1% increase in interest rates. The reasoning is that if you own a bond with a coupon of 5% but the market rate increases to 6%, no one will want to pay full price for your lower-yielding bond. Thus, the market price of your bond drops. Conversely, your bond’s price increases when interest rates drop as your bond’s coupon rate becomes more attractive relative to the market interest rate. (Note: Duration gives the approximate change in bond price since bond prices have a nonlinear relationship with interest rates and this duration formula becomes less accurate for large rate changes.)
The formula for the modified duration calculation is just a slight modification of the Macaulay duration, so the intuition from the Macaulay duration picture remains. To minimize interest rate risk, you can lower duration by owning fixed-income securities with short maturities and high coupons.
To use duration as a risk measure, you need to know the duration of the bonds and preferreds you are interested in buying. Both Excel and Google spreadsheets have an “mduration” formula that you can apply to calculate the duration of a noncallable bond. (See “Bond Duration & Convexity,” by Wayne A. Thorp, CFA, for more information.)
For a callable bond or preferred, the duration is a little trickier, as it depends on whether the bond or preferred stock is likely to be called. For preferreds, the approach we will take is the “duration to worst” that is associated with the calculation of yield to worst.
The “to worst” designation is used for callable bonds and preferred stocks. It assumes the worst-case yield for the investor. The yield to worst is simply the minimum of yield to maturity and yield to call. This calculation assumes that bonds and preferreds trading at a premium to par value will be called, while bonds and preferreds trading at a discount to their par value will remain outstanding. Since issuers usually call premium bonds and preferreds and leave discount bonds and preferreds outstanding, the worst case tends to be an accurate base case for estimating yield.
The duration to worst also assumes the same worst-case scenario, meaning discounted bonds and preferred stocks will not be called, while those trading at premiums will.
The duration to worst of a perpetual preferred trading at a discount to par is given by the simple formula:
Duration = 1 ÷ y
Where y is the current yield of the preferred.
The duration of a preferred trading at a premium to par can be calculated using the mduration formula by replacing the bond maturity date with the preferred stock’s call date. This calculation also requires a price adjustment found by subtracting the accrued dividend from the trading price (preferred prices are quoted including accrued dividends whereas bond prices are not).
In case these duration concepts are confusing, consider the upcoming closed-end preferred example to make things more concrete.
Credit risk is the risk of default. As shown in Table 1, credit agencies such as S&P and Moody’s provide credit ratings on certain fixed-income investments. I have added historical corporate default rates from S&P Global Ratings to give a feeling for how often bonds of different credit ratings default.
Investments rated Baa3/BBB- and above are denoted investment grade, whereas investments rated Ba1/BB+ and lower are rated speculative or junk and are more susceptible to bankruptcy.
Notice in Table 1 that default rates for investment-grade bonds have been less than 0.25% for defaults occurring within one year. However, as the time periods increase to seven years the default rate increases significantly (to as much as 3.63% for the BBB- category). This is still much safer than junk bonds, whose default rates range from 4.59% to 49.82% over seven years.
Not all fixed-income investments are rated. We can generally assume the rating for an unrated investment would be less than investment grade, though sometimes issuers simply decide not to pay the ratings agencies to get a rating.
Even without an actual default, there is a risk that our fixed-income investment’s value may decline. For example, yields on riskier bonds increase (and prices decrease) as investors perceive greater default risk in the economy, such as increased bankruptcies within a recession. This risk is described as “spread widening,” as the yield spread between our investment and the U.S. Treasury rates increases.
In general, the smart fixed-income investor seeks to maximize return while taking the least amount of risk. This can often be simplified to finding the highest-yielding securities for a given level of credit and interest rate (duration) risk.
This process is akin to price-comparison shopping and can be performed by using bond screeners available at many brokerage firms. You set the credit quality and maturity parameters and then search for the highest yields for a given level of credit and duration risk. Unfortunately, I know of no such screeners for preferred stocks. I simply use a spreadsheet to track the prices and yields of preferreds in similar sectors and look for the best deals.
Not all credit ratings are perfect, and not all fixed-income investments have credit ratings. As such, I recommend performing some evaluation of the issuer’s credit on your own, particularly for investments on the riskier side of the credit spectrum.
Check the issuer’s income and cash flows to evaluate the likelihood of future income being enough to comfortably support interest and preferred dividend payments. Also check a corporate issuer’s stock price. Be cautious if the stock price has experienced a recent precipitous drop or is trading abnormally low, as there may be important economic or company news. In uncertain or recessionary environments, it also helps to check for large debt maturities maturing in the not-too-distant future that might be hard to refinance.
There can be exceptions to minimizing risk for the enterprising investor. For example, if you are highly confident that interest rates will decline, you can buy high-duration investments that will outperform in a declining interest rate environment. Similarly, if you believe that investors are exaggerating the risk of bankruptcy, you can buy junk bonds that will outperform when credit fears subside.
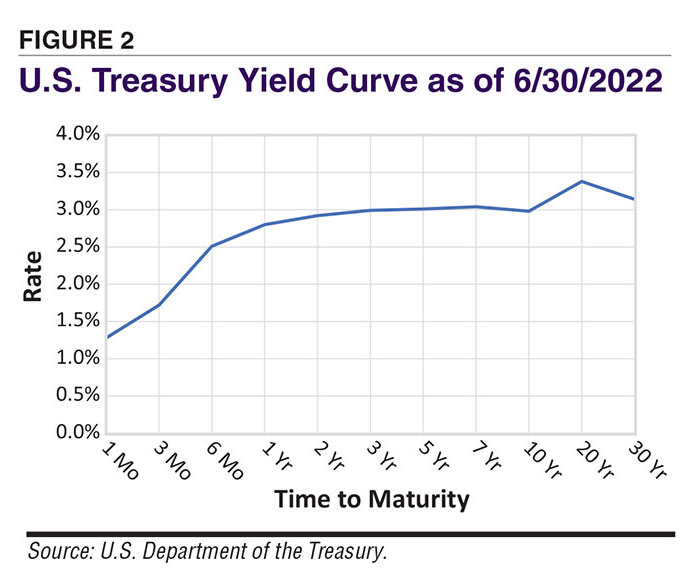
As shown in Figure 2, the yield curve is a plot of U.S. Treasury borrowing rates as a function of time to maturity. It provides the rate you would earn by buying a U.S. Treasury bond of a given maturity. The yield curve greatly influences other borrowing rates such as those of corporate bonds, municipal bonds and mortgages. Mortgages and corporate bonds trade at a positive spread to U.S. Treasuries (i.e., higher rates) due to their greater risks, while municipal bonds can trade at higher or lower rates, as their tax advantage can offset their greater risk.
The yield curve is important for many reasons. Among them is that the yield curve has been an accurate predictor of recessions. Typically, the yield curve is upward-sloping—investors in longer-maturity Treasuries demand higher rates to compensate them for the risk. When the yield curve has a negative slope (for example, in Figure 2 the 30-year bond yields less than the 20-year bond), yield-curve inversion occurs and can signal that bond investors fear a recession. This is one of the instances where some bond investors decide to take on higher duration risk (such as by favoring the 30-year bond over the 20-year bond) because they believe a recession will take place and interest rates will decline.
Although different economists track different parts of the yield curve for inversion, the indicator I use is the two-year/10-year yield spread. This is the value of the two-year note’s yield subtracted from the 10-year note’s yield. Although no indicator is perfect, this spread has been a highly accurate predictor of future recessions with a typical lag time of six months to two years following inversion.
The second use of the yield curve is for finding maturities with good risk/reward trade-offs. Again, consider Figure 2. For those looking to minimize rate risk, a two-year Treasury note offers almost the same yield (2.92%) as the 10-year bond (2.98%) with less than a quarter of the risk (1.93 duration for the two-year note versus 8.59 duration for the 10-year note). For those willing to take duration risk, the 20-year U.S. Treasury bond (duration of 14.45), provides the highest yield of 3.38%.
In this section and the next, I provide real-world examples of how I analyze potential preferred stock and bond investments. These examples should not be construed as investment recommendations but rather as examples of how to evaluate risk and return.
Mostly perpetual or having long-dated maturities, preferreds tend to be very sensitive to a sharp increase in interest rates. Thus, sharp rate increases can lead to opportunities to buy what’s called busted preferreds—preferreds that trade well below their $25 par price with the potential for attractive yields and capital gains.
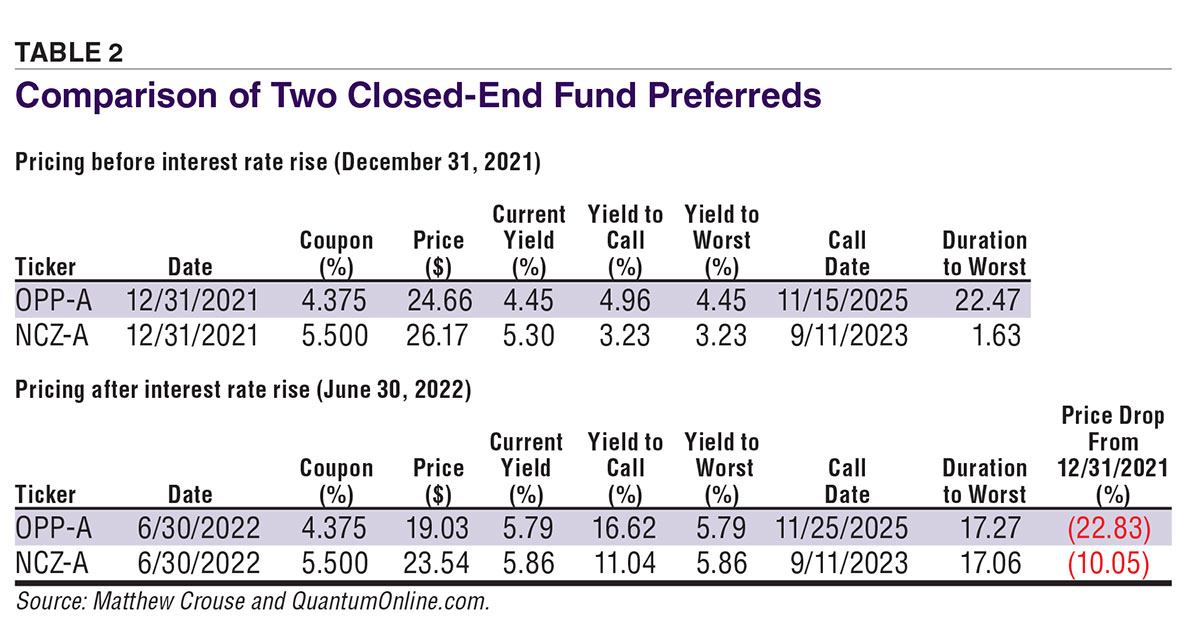
In Table 2, we compare the price behavior of two perpetual closed-end fund preferreds: Rivernorth/DoubleLine Strategic Opportunity Fund Series A (OPP-A) and Virtus AllianzGI Convertible & Income Fund II Series A (NCZ-A, formerly named AllianzGI Convertible & Income Fund II Series A). These preferreds are of relatively high credit quality, with OPP-A rated A1 by Moody’s and NCZ rated A1. (Although Moody’s does not rate NCZ-A itself, the credit rating of a preferred is typically one notch lower than the rating of its issuer, suggesting a possible A2 rating for NCZ-A.)
Notice in the “before interest rate rise” section of Table 2 that the duration to worst of OPP-A (22.47!) was much greater than the duration to worst of NCZ-A (1.63). NCZ-A had a more attractive coupon of 5.50% versus 4.375% for OPP-A. NCZ-A thus traded at a large premium to $25 par, implying that the NCZ-A coupon rate was above the market rate and would likely be called on September 11, 2023, hence NCZ-A’s short duration.
In the “after interest rate rise” section of Table 2, we see large negative price changes for both securities as their yield to worsts approach the 6% level. The lower duration of NCZ-A led to less than half the price decline than occurred in OPP-A. This is still a greater decline than we would predict from NCZ-A’s “before” duration, as it moves from a premium preferred with low duration of 1.63 to a discount preferred with high duration of 17.06. This wild swing in duration is a negative feature of callable income investments trading close to par. Otherwise, duration is a fairly steady number and a good predictor of price risk.
Note that both preferreds, now trading at significant discounts to par, have similar yields (just under 6%) and durations (around 17 years). If interest rates increase further, they should both see a similar percentage drop in price. The 5.79% yield on OPP-A is slightly lower, but OPP-A has more upside to $25 par value should rates decrease significantly.
Busted preferreds trading well below par offer an opportunity for the investor with the right outlook and risk tolerance. Risk tolerance is important because busted preferreds have high durations and will experience continued large price drops should rates rise. What’s more, many preferreds and preferred stock closed-end funds have low trading volume and large bid-ask spreads. For instance, our NCZ-A example has an average trading volume of less than 5,000 shares per day, making it difficult to buy and sell. Use limit orders instead of market orders and expect to require effort both in buying and selling.
That said, if a busted preferred’s yield to worst offers an attractive long-term return, you can buy the preferred and simply “ride out” the price changes knowing that you will be receiving that attractive rate each year. Historically, I have set my income threshold at 7% for high-credit-quality fixed-income securities, although I have started nibbling at some high-quality securities yielding lower than 7%.
Interestingly, when I have bought what I deemed attractive yields for long-term investment, I have often found that rates eventually decrease, in which case I end up with significant price gains. This offers a second possibility for busted preferreds: If you believe interest rates will eventually decrease, then these preferreds can offer substantial capital gain opportunities.
Busted preferreds of more speculative companies can also be attractive investments but require a more careful credit analysis. In the event of a bankruptcy, preferred stocks typically receive no payment on liquidation. Therefore, you should determine that the price drop is due to higher interest rates as opposed to being an indication of a significant risk of default in the company itself.
I recommend the site QuantumOnline.com as a practical resource for investing in preferred stocks. The website is free, but registration is required. Not only does QuantumOnline provide excellent information on individual preferreds, but it also includes lists of preferred and exchange-traded debt initial public offerings (IPOs). In the fourth quarter of every year, I sift through the past two years of IPOs to look for busted preferreds and indications of investor tax-loss selling that sometimes leads to artificially low prices and attractive “steals and deals.”
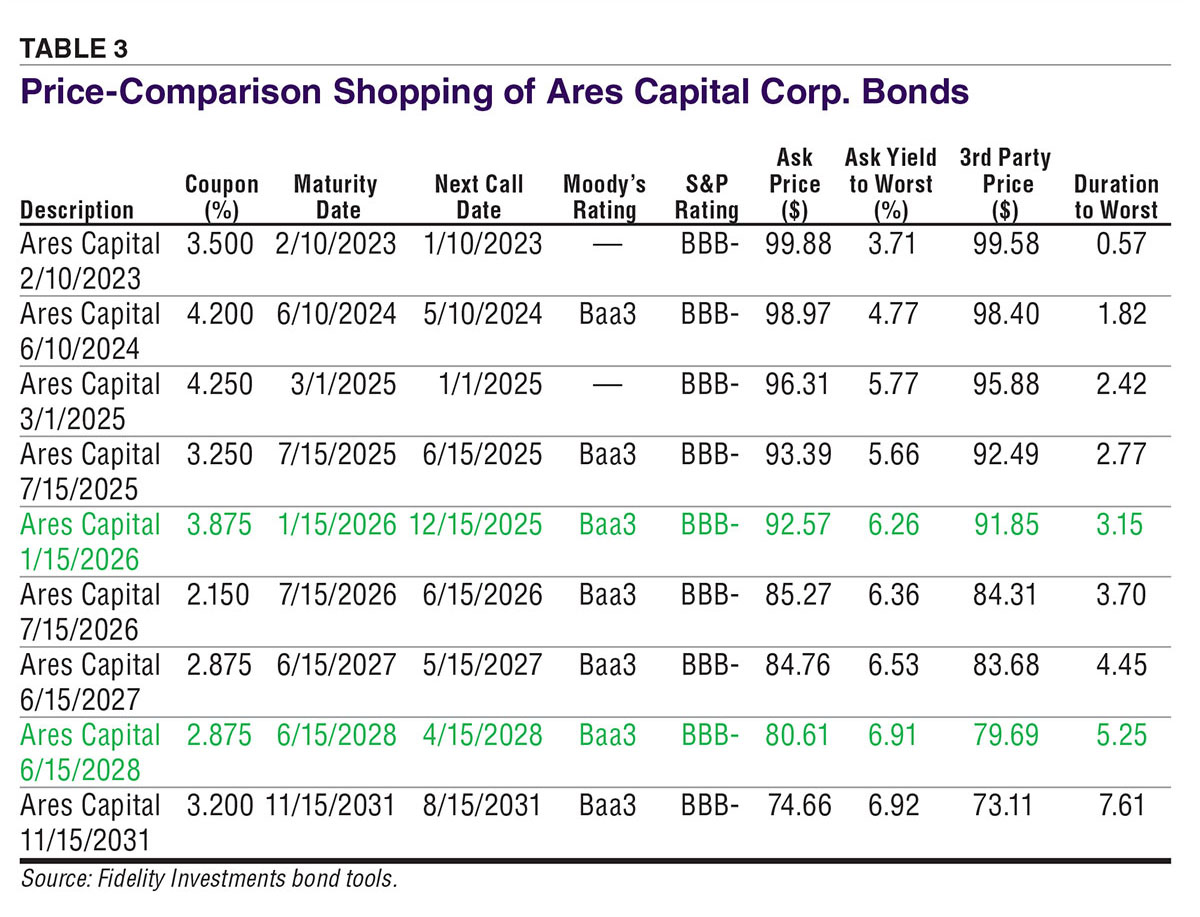
In Table 3, I show how I think about price-comparison shopping in bonds as I look for the Ares Capital Corp. bonds with the best yield/duration-risk trade-off. For the sake of illustration, I am assuming a comfort level with taking the credit risk of Ares Capital, which is rated Baa3/BBB-, or just barely investment grade.
The bonds are sorted in order of maturity. As shown in the description column, the bonds are identified by their maturity date. Note that par value is $100 for these bonds, not $25 as for the preferred example. The ask price and ask yield to worst are the price you would pay to buy the bond and the yield you would receive from buying at the ask price.
Note that there is a significant trade-off between risk and yield. The safest bond maturing in 2023 (with a duration of 0.57) only yields 3.71%, while the riskiest bond maturing in 2031 (with a duration of 7.61) yields 6.92%. I have highlighted in green what bonds appear to be attractive relative to neighboring bonds.
For those willing to take greater interest rate risk (duration of 5.25), the 2028 bond compares favorably to the 2027 and 2031 bonds. The 6.91% yield of the 2028 bond is roughly the same as the 2031 bond, which has a much higher duration. I would also argue that the 6.91% yield is a significant step up from the 6.53% yield of the 2027 bond and thus worth the longer duration and maturity.
For those looking for somewhat lower interest rate risk (duration of 3.15), the January 2026 bond compares favorably to the July 2025 and July 2026 bonds. The yield increase from the July 2025 bond to the January 2026 bond is a hefty 0.60%, whereas the yield increase from the January 2026 bond to the July 2026 bond is only 0.10%.
When trading bonds, I check trade data and third-party pricing. Trade data is important because bonds are traded in dealer markets where there is a risk of paying a high markup relative to the fair value of the bond. Trade data from the Financial Industry Regulatory Authority (FINRA) (https://finra-markets.morningstar.com/BondCenter/Default.jsp) is most relevant because it includes actual trades. (Use the search tool to find a specific issuer or bond.)
Note that dealers report trades to FINRA and indicate whether the dealer is buying or selling. The fair value of a bond is typically shown in dealer-to-dealer trades whereas dealer-customer trades are often biased. The rule of thumb is that the customer always gets a bad deal (i.e., the dealer sell prices are too high and the dealer buy prices are too low). Be careful to check the date on the trades, as not all bonds trade every day.
When buying corporate bonds, I expect a modest paper loss on the original purchase but try to limit this loss to less than $0.30 per bond versus a recent dealer-to-dealer price. Note that some brokers, such as Fidelity and Interactive Brokers, charge roughly $0.10 per bond, whereas other brokers may mark bond prices up as much as a dollar.
Although less relevant since it is model-based (and I believe biased slightly low), third-party pricing provided by brokers will be the value shown in your account on a daily basis. In Table 3, the third-party pricing is mostly $0.50 to $1.00 below the ask price. The Ares Capital 2031 bond is the one outlier at $1.55 below the ask price, suggesting that the bond might be an unattractive buy at the ask price of $74.66.
If it is not clear already, broker fees and dealer bid-ask spreads make active bond trading more expensive for the individual investor. Bond investments are more suited for buying and holding with the possibility of occasional portfolio-rebalancing trades. However, one advantage of bonds over preferreds is the finite maturity date that allows you to lock in a guaranteed attractive return (assuming no defaults).
Given recent interest rate increases, many bonds and preferreds are now offering attractive yields, yields that are much higher than they have been in years. Although significant risk remains, you can control your risk by adjusting the duration and credit parameters of your investment. Even though it is impossible to explain all aspects of bond and preferred trading in one article, I hope to have provided you the basic tools and fundamental understanding to explore these investments further on your own.
Investor Professor

Portfolio Strategies


CHARLES S from NM posted over 4 years ago:
MATTHEW C from UT posted over 4 years ago:
GARY K from TX posted over 4 years ago:
MATTHEW C from UT posted over 4 years ago:
MATTHEW C from UT posted over 4 years ago:
Varuj G from CA posted over 3 years ago:
MATTHEW C from UT posted over 3 years ago:
You need to log in as a registered AAII user before commenting.
Log InCreate an account