


Related

AAII How-To
Portfolios of companies with strong price momentum have realized higher returns than the portfolios of companies with weak momentum.
by Charles Rotblut | June 2024

Charles Rotblut leads a class in AAII's new Essential Investing Video Course. Go to https://www.aaii.com/ves for more information and to subscribe.
Momentum is a characteristic of stocks that mixes well with other traits. AAII’s Zweig screen, which is featured in this month’s issue, is a good example. It incorporates price momentum along with the unique growth, value and quality traits it seeks in stocks.
The momentum factor is based on the simple concept that outperforming stocks will continue to outperform. Over time, portfolios of companies with strong price momentum have realized higher returns than the portfolios of companies with weak momentum. Companies with weak momentum are those that are underperforming.
In this article, we discuss the momentum factor, explain where on AAII.com you can find momentum data for specific stocks and give you tips on how to incorporate it with your fundamental analysis.
Many of you may recognize momentum as relative strength. Relative strength (also referred to as relative price strength) underlies the momentum factor. It is the return of an asset relative to another asset or group of assets. If shares of Acme Inc. appreciate by 10% and shares of Gizmo rise by 8% over the same period, Acme will have better relative strength. Its stock performed better than Gizmo’s stock did.
Relative strength over periods of 13, 26 and 52 weeks are commonly used to gauge momentum. AAII’s Momentum Grade uses a weighted four-quarter relative strength measure. This assigns a 40% weight to a stock’s relative strength over the most recent 13 weeks and a 20% weight to a stock’s relative strength over each of the three previous 13-week periods. (The Momentum Grade is included in A+ Investor, VMQ Stocks and AAII Platinum subscriptions.)
Momentum was first identified as a key explainer of stock price returns not long after value and size were. In a 1993 Journal of Financial Economics paper, Narasimhan Jegadeesh and Sheridan Titman found that stocks with strong relative strength outperformed. They further observed that the success of momentum was not “confined to any particular subsample of stocks.”
A 1997 Journal of Finance paper by Mark Carhart added to the evidence. Carhart found that stock returns could be explained by four distinct factors: volatility (high versus low beta), size (large versus small market capitalization), valuation (value versus growth) and momentum (one-year strong momentum versus contrarian stocks).
The data compiled by Dartmouth professor Kenneth French continues to support both papers. Portfolios of large and small stocks exhibiting strong momentum realized annualized gains of 15.0% and 18.7%, respectively, during the period of 1946 through 2023. Weak-momentum portfolios of large stocks returned 6.5% and weak-momentum portfolios of small stocks returned 7.4% on average over the same period.
Momentum works due to a combination of reasons including the three listed here.
Investors underreact to earnings news, leading to delays in the new information being priced into the stock. This is often referred to as the post-earnings-announcement drift (PEAD). Investors anchor their opinions to past expectations and are often slow to adjust their opinions to the new information. As earnings estimates are revised upward or downward, stocks move in similar directions. Such delayed reactions can continue for several quarters.
A lack of adequate research conducted by investors is another reason. Rather than doing an in-depth analysis of stocks, investors often simply look at the stocks that have performed well recently. They assume the stock’s outperformance reflects optimistic sentiment about the company’s business prospects.
Risk also plays a role. Investors demand higher returns as compensation when there are perceived risks to cash flow, higher costs of capital and/or higher valuations.
AAII members can see a stock’s momentum on the AAII Stock Evaluator page. To access it, simply type a stock’s name or ticker symbol into the search box located at the top of most pages on AAII.com.
Once there, scroll about halfway down the page to the Financial Summary. The Share Statistics section reports the 52-week price change for the stock. It also shows you how the stock’s price performance compares to all other stocks in the Percentile (All Stocks) column. As shown in Figure 1, United Rentals Inc.  (URI) has outperformed 94% of all stocks over the past 52 weeks. This is equivalent to a relative price strength rank of 94—an indication of very strong momentum. [United Rentals is held in the VMQ Stocks model portfolio.]

The 52-week relative price strength rank is one of the measures that can be used to judge how strong or weak a stock’s momentum is. Higher percentages indicate stronger momentum and lower percentages indicate weaker momentum. The aforementioned French data is based on the top third (strongest) and bottom third (weakest) of stocks for each calendar year (52-week relative strength).
Based on this, a rule of thumb would be to seek out stocks with relative strength ranks of 67% or higher and avoid those with relative strength measures of 33% or lower. The VMQ Stocks strategy uses a top 60% cutoff for adding stocks and removes stocks whose momentum ranks in the bottom 20%.
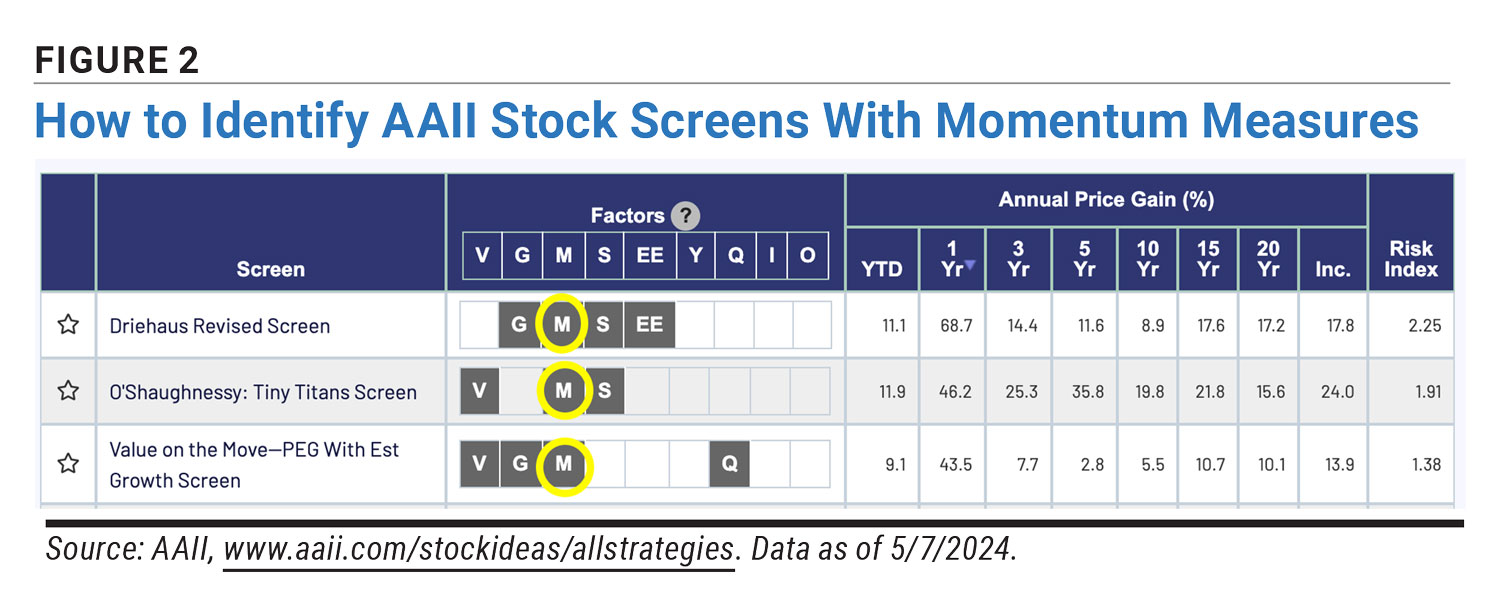
Several of AAII’s stock screens include a momentum requirement in the criteria. Many do so in conjunction with other criteria, as mentioned with the Zweig screen. Others include, but are not limited to, the Lakonishok, Value on the Move PEG With Estimated Growth and O’Shaughnessy Tiny Titans screens.
AAII members can see which stock screens incorporate momentum and access those screens on the All Screens page. Look for screens designated with an “M” in the Factors column (Figure 2). Click on the question mark next to the Factors column heading to find out what each factor initial stands for.
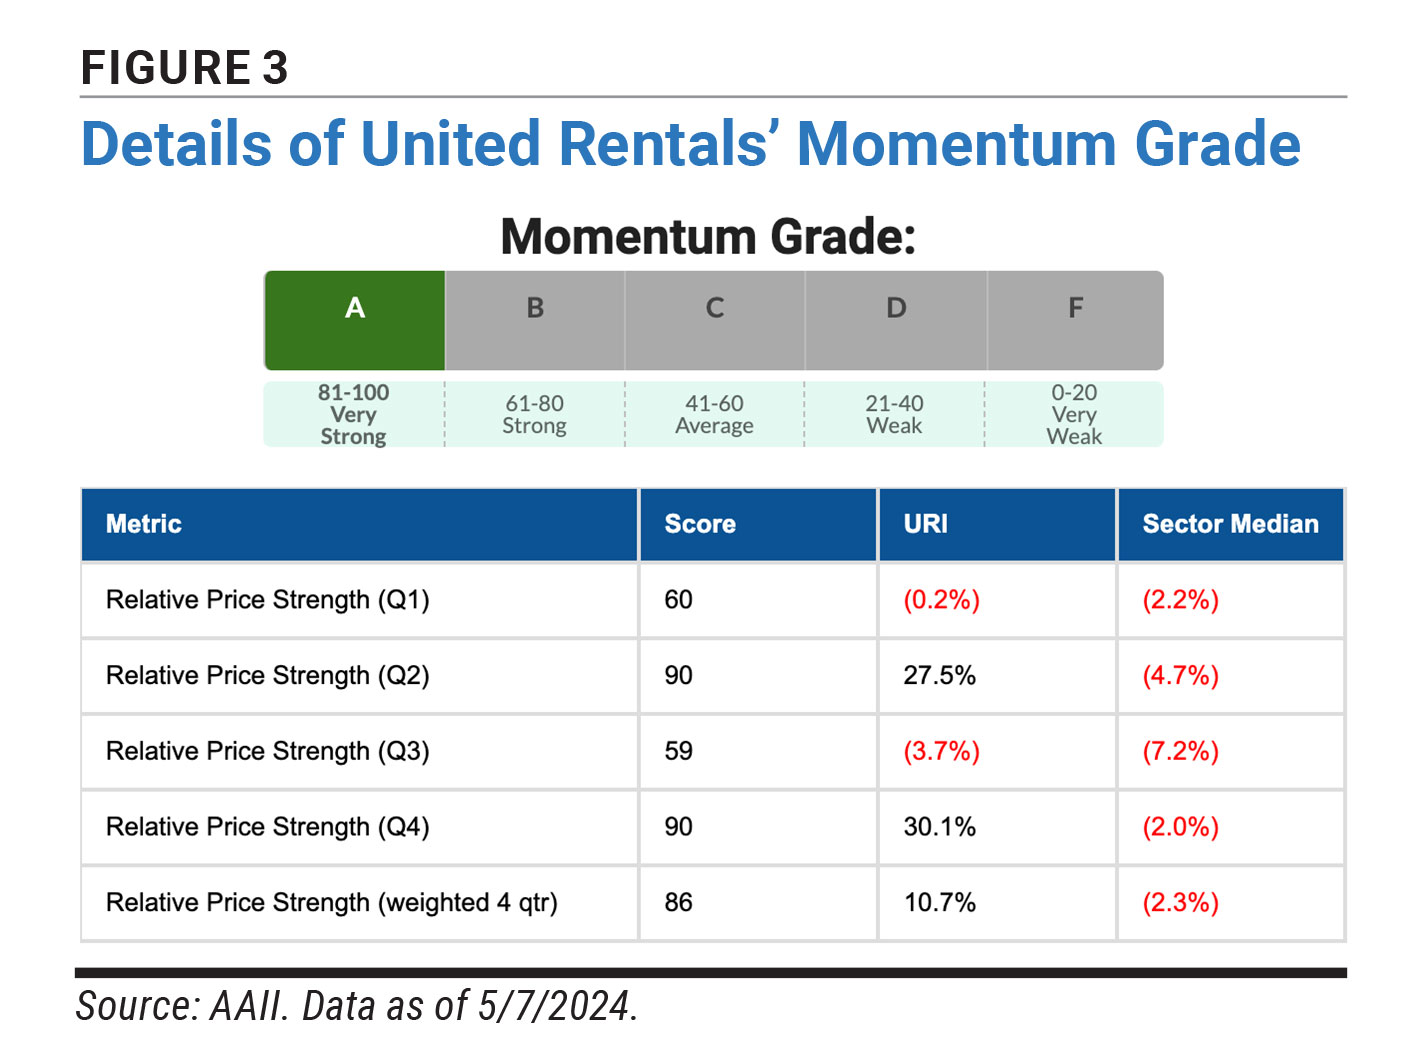
Subscribers to our A+ Investor and Platinum services also have access to the Momentum Grade. As previously noted, the Momentum Grade uses a weighted four-quarter measure instead of looking at absolute 52-week relative strength.
The Momentum Grade and details about the individual quarterly performance underlying it can be found in the Grades tab of the Stock Evaluator (Figure 3). The quarters go from the most recent to the oldest. The first column shows the relative price strength rank. Shares of United Rentals experienced their strongest momentum during the second-most-recent (Q2) and fourth-most-recent (Q4) 13-week periods, with ranks of 90. United Rentals still outperformed 60% of all stocks during the most recent quarter (Q1), as evident by the rank of 60.
Custom screens to identify stocks with very strong (A) or strong (B) Momentum Grades can be created on the AAII Custom Stock Screener. Here, A+ Investor and AAII Platinum subscribers can either screen for the grade directly or incorporate it with other criteria such as value and quality. (Momentum pairs very well with value-based strategies.)
A+ Investor and Platinum subscribers can also see the Momentum Grade—along with the other grades—for the stocks they own or follow in My Portfolio. Once a portfolio has been created, click on the Grades tab to see the Momentum Grade for each stock.
AAII How-To

Value Investing


BARRY J from TX posted over 2 years ago:
MANJUNATH S from CA posted over 2 years ago:
RONN K from WA posted over 2 years ago:
Catherine L from NC posted over 2 years ago:
HARVEY L from MN posted over 2 years ago:
BARRY J from TX posted over 2 years ago:
You need to log in as a registered AAII user before commenting.
Log InCreate an account