



It is often said that diversification is the only free lunch provided on Wall Street. By diversifying your stock portfolio using fundamentally different strategies, you can improve the risk-adjusted return of your overall portfolio compared to the individual strategies. Many approaches have strong long-term returns but can occasionally fall temporarily out of favor.
AAII’s Platinum service gives you exclusive access to five model stock portfolios derived from seminal academic research and approaches followed by some of Wall Street’s most successful investors. Combined, AAII’s Model Shadow Stock Portfolio, AAII Dividend Investing, Stock Superstars Report, VMQ Stocks and—the newest addition—AAII Growth Investing offer more than 100 stocks selected and vetted using AAII’s long-standing commitment to evidence-based investing.
Platinum also includes AAII’s A+ Investor research and tracking platform that includes the A+ Stock Grades. This stock-grading research tool allows you to use a systematic approach to evaluating stocks based on five investment factors: value, growth, momentum, earnings estimate revisions and quality. These grades mirror five of the most compelling factors used to differentiate companies and build portfolios that match your investment style.
The Platinum 30
Using AAII’s A+ Stock Grades, we highlight 30 stocks, choosing a few from each model portfolio that best encapsulate the respective portfolio strategies. Each portfolio has its own filtering criteria.
AAII Model Shadow Stock Portfolio
Arguably one of the longest-running real-world factor-based stock portfolios, the Model Shadow Stock Portfolio reflects an investing philosophy that holds that:
- The best stocks for individual investors are not the same stocks that are best for institutions;
- Ultimately, the best returns come from giving major consideration to risk; and
- Success comes more from concern for the overall portfolio than for individual stocks.
Taken individually, company size and valuation are criteria investors have used to select stocks that have outperformed the broader market over the long term. Uniquely, it was discovered that while each approach could be used independently to construct successful portfolios, they were different enough that when combined they yielded even better performance than the individual approaches.
The challenge was constructing a set of practical rules that our members could easily follow to take advantage of the approach. The Model Shadow Stock Portfolio approach has been refined over the years to adjust to new research while seeking to minimize the transaction costs of investing in micro-cap stocks that are realistically out of reach from most institutional investors and therefore in the shadows of Wall Street.
Members can follow the Model Shadow Stock Portfolio online and in the AAII Journal. We have also incorporated the research into the Platinum service. The Platinum 30 pulls in three of the stocks currently in the portfolio, first identifying those holdings that currently meet the small size, attractive value and profitability criteria. We then select only the holdings that exhibit the best combination of value and quality, based on the A+ Stock Grades.
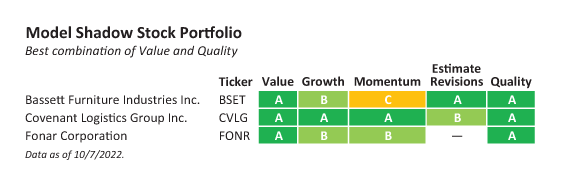
Bassett Furniture Industries Inc.  (BSET) is a stock in the Model Shadow Stock Portfolio, and it is currently a part of the Platinum 30. As of October 7, the company has a price-to-book-value (P/B) ratio of 0.74, along with a market capitalization of $146.9 million. The company is currently passing the criteria required to be added to the portfolio, as the recent market decline has created opportunities for value investing.
AAII Dividend Investing
AAII Dividend Investing’s (DI) strategy is to buy, collect and grow—buying attractively valued stocks of companies with a track record of raising their dividends and that are likely to see both their dividend payments and their share prices rise in the future—a total-return strategy. The advantage of total return is that it gives investors the potential for a win-win combination. Net worth is increased by both the change in the stock’s price and the payment of the dividend. Stock prices are unpredictable, of course, so there is no guarantee that the total return will be positive for any specific stock held in the portfolio. But the presence of a dividend provides another component of return in an investor’s favor.
To achieve these goals, DI focuses on three pillars when making dividend investment decisions. The three pillars of dividend investing are a firm’s growth trends, financial strength/quality and valuation.
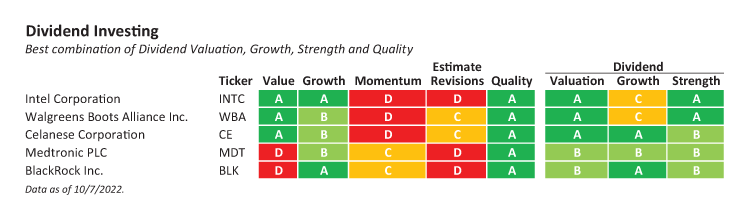
BlackRock Inc. (BLK) is a current holding in the DI portfolio, and also a part of the Platinum 30. When looking at how BlackRock fits into the DI strategy, the company has a five-year dividend growth rate of 12.5%, along with sales growth of 9.6% and diluted earnings per share from continuing operations growth of 15.0% over the same period. The company has a current earnings payout ratio of 42.8% and the pre-dividend free cash flow per share of $29.66 more than covers the indicated annual dividend payment of $19.52. As of October 7, the company has an attractive price-earnings (P/E) ratio of 14.5, below the company’s five-year average of 18.1. Additionally, the dividend yield of 3.5% is well above the company’s five-year average of 2.5%. The company has paid a dividend since 2003 and has increased it for 13 consecutive years.
BlackRock is one of five attractively graded companies in the Platinum 30 that represent the AAII Dividend Investing strategy looking for growth trends, financial strength/quality and valuation.
AAII Growth Investing
AAII Growth Investing, the newest portfolio, follows a bottom-up analysis approach using a proprietary but fully transparent selection methodology to identify stocks with a history of consistent growth, profitability and cash generation. In addition, these stocks have fundamental characteristics that research has shown to generate more growth in the future. Furthermore, stocks chosen for the Growth Investing model portfolio must exhibit minimum levels of quality, as defined by AAII’s proprietary Quality Grade.
AAII Growth Investing focuses on secular growth—stocks with attributes that make them likely to continue growing regardless of the economic cycle—instead of buying into cyclical stocks, which tend to rise and fall rapidly. This strategy uses the groundbreaking G-Score research from Partha Mohanram as well as the A+ Growth Grade, designed to identify stocks with consistent growth potential.
AAII Growth Investing also gives you the ability to analyze over 7,000 stocks to see how they fit within the Growth Investing strategy. The Growth Analyzer tool shows you how a stock scores according to the Growth Investing strategy.
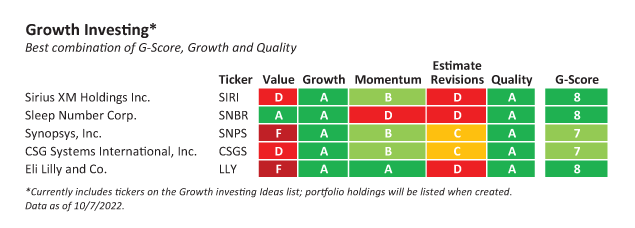
Sleep Number Corp. (SNBR) is a company on the Growth Investing ideas list and is currently part of the Platinum 30. Sleep Number currently has five-year sales growth of 10.8% and a year-over-year sales growth rate of 17.7%, both important contributors to its A+ Growth Grade of A. Additionally, Sleep Number currently has a G-Score of 8, giving the company both of the initial requirements for the strategy.
The five attractively graded Growth Investing stocks that are a part of the Platinum 30 are currently from the Growth Investing Ideas list. When the portfolio is created, starting on November 1, the stocks in the Platinum 30 will be current portfolio holdings that rate highly across the portfolio’s criteria of the G-Score and Growth Grade, along with the A+ Quality Grade.
Stock Superstars Report
The investing landscape is littered with failed investment professionals and strategies. However, a select few approaches and “gurus” have stood the test of time. AAII’s SSR portfolio looks to these “superstar” strategies and investors to use four distinct selection methodologies. The four approaches are built on: William O’Neil’s CAN SLIM growth and momentum approach; David Dreman’s large-cap value strategy that also relies on earnings estimate revisions and surprises to identify potential shifts in the market’s perception; James O’Shaughnessy’s factor-based approach to stock selection; and John Neff’s low price-earnings, fundamental growth strategy.
Group 4 of the SSR portfolio follows John Neff’s value investing approach, and the dividend-adjusted price-earnings-to-earnings-growth (PEG) ratio serves as the foundation. It is calculated by dividing the trailing price-earnings ratio by the sum of the estimated earnings growth rate and the dividend yield. The dividend-adjusted PEG ratio encompasses each of the key components of Neff’s value investing style—the price-earnings ratio, earnings growth estimates and the dividend yield. While a company needs to be tracked by an analyst to have a meaningful forecasted earnings growth rate, a company does not have to pay a dividend.
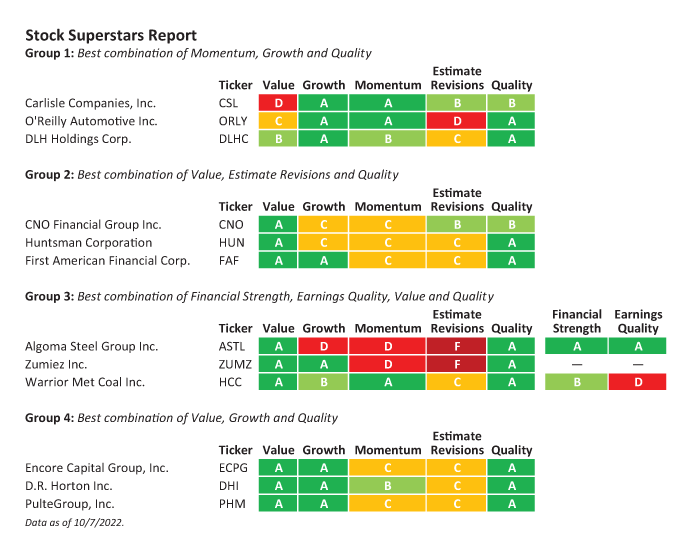
Looking at the holdings from Group 4 in the Platinum 30, D.R. Horton Inc. (DHI) highlights the strategy well. With a projected earnings growth rate of 12.0%, a trailing price-earnings ratio of 4.6 and a 1.3% dividend yield, the company has a dividend-adjusted PEG ratio of 0.35 compared to the industry average of 1.22. A PEG under 1.0 can suggest that a company is undervalued; this is why it is used in the Group 4 Neff strategy, which aims to find value in the market. Another important factor that Group 4 considers is sales growth, since where sales are increasing (all other things equal) earnings follow. D.R. Horton has five-year sales growth of 18.0%.
Using the A+ Stock Grade factors of momentum, growth and quality, we present three of the current highly rated Group 1 O’Neil SSR holdings. The three Group 2 Dreman stocks in the Platinum 30 portfolio rate the highest in terms of value, estimate revisions and quality. The three featured Group 3 O’Shaughnessy stocks exhibit the strongest elements of financial strength, earnings quality and value. Lastly, using factors of value, growth and quality, we present three attractively graded Group 4 Neff stocks.
VMQ Stocks
The letters VMQ stand for value, momentum and quality—three traits associated with higher returns and lower risk. The VMQ Stocks strategy is based on two of the strongest indicators of outperformance in investing: value and momentum. Though the two factors pair well together, solely using value and momentum as investment criteria results in too many stocks to consider. Adding a quality requirement to the mix narrows down the list of candidates to a manageable level. The quality overlay also helps to identify stocks with additional traits associated with higher returns and eliminates stocks with other traits associated with poor returns.
VMQ Stocks seeks stocks whose valuations rank in the bottom 40% of all exchange-listed stocks and whose weighted four-quarter price returns (momentum) rank in the top 40% of all stocks. The quality component then requires all companies to exhibit above-average underlying fundamental strength (strongest 40%).
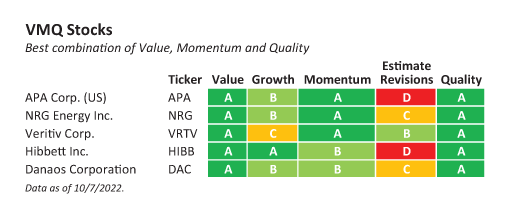
Veritiv Corp. (VRTV) is a stock in the VMQ model portfolio that is also currently part of the Platinum 30. With Value, Momentum and Quality Grades of A, the company currently qualifies under the VMQ Stocks rules for adding a stock to the portfolio.
The Value Score is calculated using percentile ranks of six different valuation metrics, including the price-earnings ratio and the price-to-sales (P/S) ratio. As of early October, Veritiv ranks in the cheapest 15% and 7% for these two metrics, respectively, with a price-earnings ratio of 5.9 and a price-to-sales ratio of 0.21.
The Momentum Score is a calculation of relative strength, or how well a stock performs against a benchmark over a set period of time (in this case, the last four quarters) relative to all other stocks. Percentile rankings are used to make comparison easier. Its Momentum Grade of A signifies that Veritiv has outperformed most stocks over the past four quarters.
Veritiv’s Quality Grade is A. The Quality Score is based on eight traits, including return on assets (ROA) and change in total liabilities to total assets. The company ranks in the strongest 88th and 84th percentiles, respectively, on these two metrics. To be assigned a Quality Score, stocks must have a valid (non-null) measure and corresponding rankings for at least four of the eight quality measures.
The five VMQ stocks that are part of the Platinum 30 all rate highly across the portfolio’s factors of value, momentum and quality.
How to Use the Platinum 30
The Platinum 30 is presented to give you sample of the stocks held in each model portfolio that currently have attractive grades. The stocks can and will change over time, as changes in grades will occur among the respective portfolio holdings. However, these stocks are not presented as buy recommendations. Further research is necessary before making a decision as to whether any stock on these lists is appropriate for you portfolio.
For more on AAII Platinum, please visit: www.aaii.com/platinum.

Related

AAII How-To
The Benefits of Combining Value & Momentum
Related

Financial Statements
Valuation Ratios: The PEG Ratio
Discussion
FREE REPORT

Get your free copy of our special
report analyzing the tech stocks
most likely to outperform the
market.
BARRY J from TX posted over 3 years ago:
BARRY J from TX posted over 3 years ago:
You need to log in as a registered AAII user before commenting.
Log InCreate an account