


Charles Rotblut leads a class in AAII's new Essential Investing Video Course. Go to https://www.aaii.com/ves for more information and to subscribe.

- Overview of GICS and TRBC classification for company sectors and industries
- Differences in sector and industry grouping can impact stock comparisons and portfolio diversification
- GICS classifications may come into play with index ETFs
Sector and industry classifications serve three useful purposes to investors: They give you a general idea of what a company does, they assist you with diversifying your portfolio, and they enable you to make comparisons between a company and its peers.
There are several sector and industry classification systems. The Global Industry Classification Standard (GICS) is among the most widely used within the investing industry. GICS was jointly developed by MSCI and S&P Dow Jones Indices in 1999. We switched to using GICS on AAII websites and in Stock Investor Pro, our fundamental stock screening and research database, when we began using S&P Global Market Intelligence as our data provider on October 1, 2024.
Previously, we used data from LSEG Data & Analytics. This followed The Reference data Business Classification (TRBC) system for sectors and industries.
There is more to these classification systems than simply identifying the industry and sector that a company operates in. They also serve as a structure for sector- and industry-focused exchange-traded funds (ETFs), mutual funds, indexes and portfolio allocations.
Sector Structures of GICS and TRBC
GICS classifies companies into one of 11 different sectors, while TRBC uses 13 sectors. GICS assigns companies to sectors based on their “principal business activity.” TRBC uses economic sectors. Two of TRBC’s sectors—government activity; and institutions, organizations and associations—were not used by AAII.
Table 1 shows a comparison of the two sector classifications. There are both similarities and differences between the two.
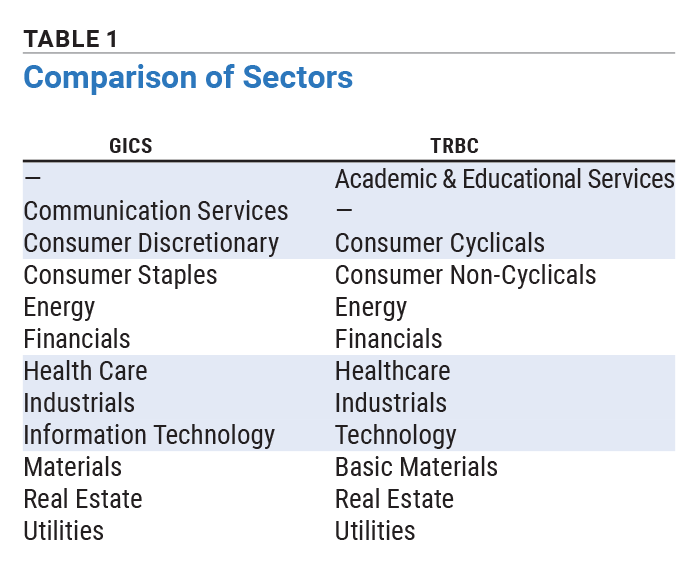
With just a glance, you can see that the academic and educational services sector does not exist in GICS. This TRBC sector had a comparatively small number of companies in it even when we used LSEG data.
A communication services sector is part of GICS. This sector was reconstructed in 2018. It went from simply a telecommunications sector to reflecting the convergence between technology, media and telecommunications. The sector encompasses companies tied to digital communications and content. Those companies include Alphabet Inc.  (GOOGL), Comcast Corp. (CMCSA), Netflix Inc. (NFLX) and Verizon Communications Inc. (VZ).
Even when sectors share similar names between classification systems, companies can be classified in different sectors. This means sector averages and medians are not directly comparable between the two classification systems.
Industry Structures of GICS and TRBC
GICS categorizes companies into one of 74 industry groups. TRBC has 154 industry groups. TRBC’s classification results in some industries consisting of only a handful of companies. Such small groups make comparisons within industries less meaningful.
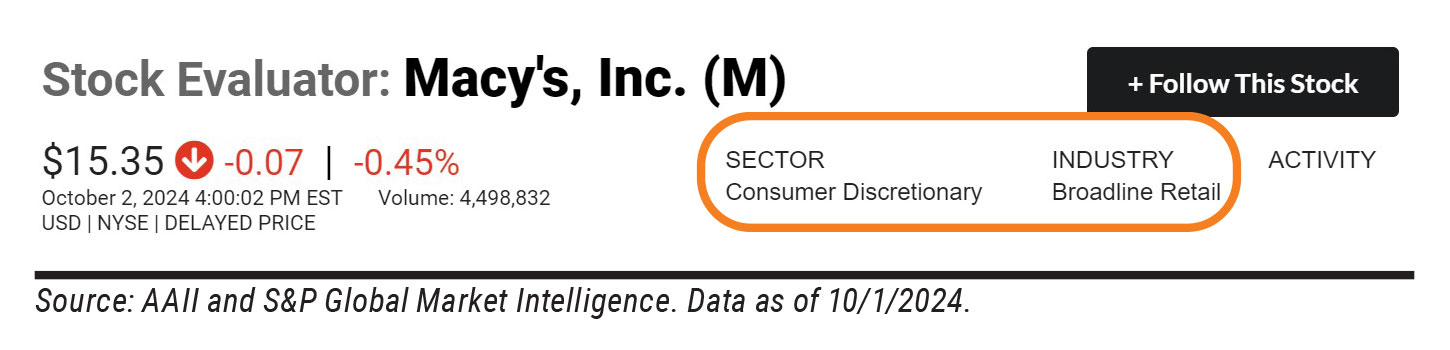
LSEG classified Macy’s Inc. (M) in the department store retailers industry group. This industry group had 24 companies in it. GICS puts Macy’s in the broadline retail industry group. This group, which replaced the formerly separate department stores and general merchandise stores industry groups, has 29 companies in it.
Comparing a Stock to Its Industry Peers
Sector and industry classifications are located near the top of the Stock Evaluator page on AAII.com for all stocks (Figure 1). To access it, simply type a company’s name or ticker symbol into the search box at the top of any webpage. Industry group designations are also shown in My Portfolio. Click on Fundamentals in the blue navigation bar of the Portfolio tab. The AAII premium model portfolios (Dividend Investing, Growth Investing, Stock Superstars Report and VMQ Stocks) also list industry and sector information for their respective holdings.
At the bottom of the Stock Evaluator snapshot page are comparisons between the stock and its industry median for share statistics, growth rates, financials, valuations and ratios (Figure 2). These help you quickly assess how a particular company stacks up against its peers.
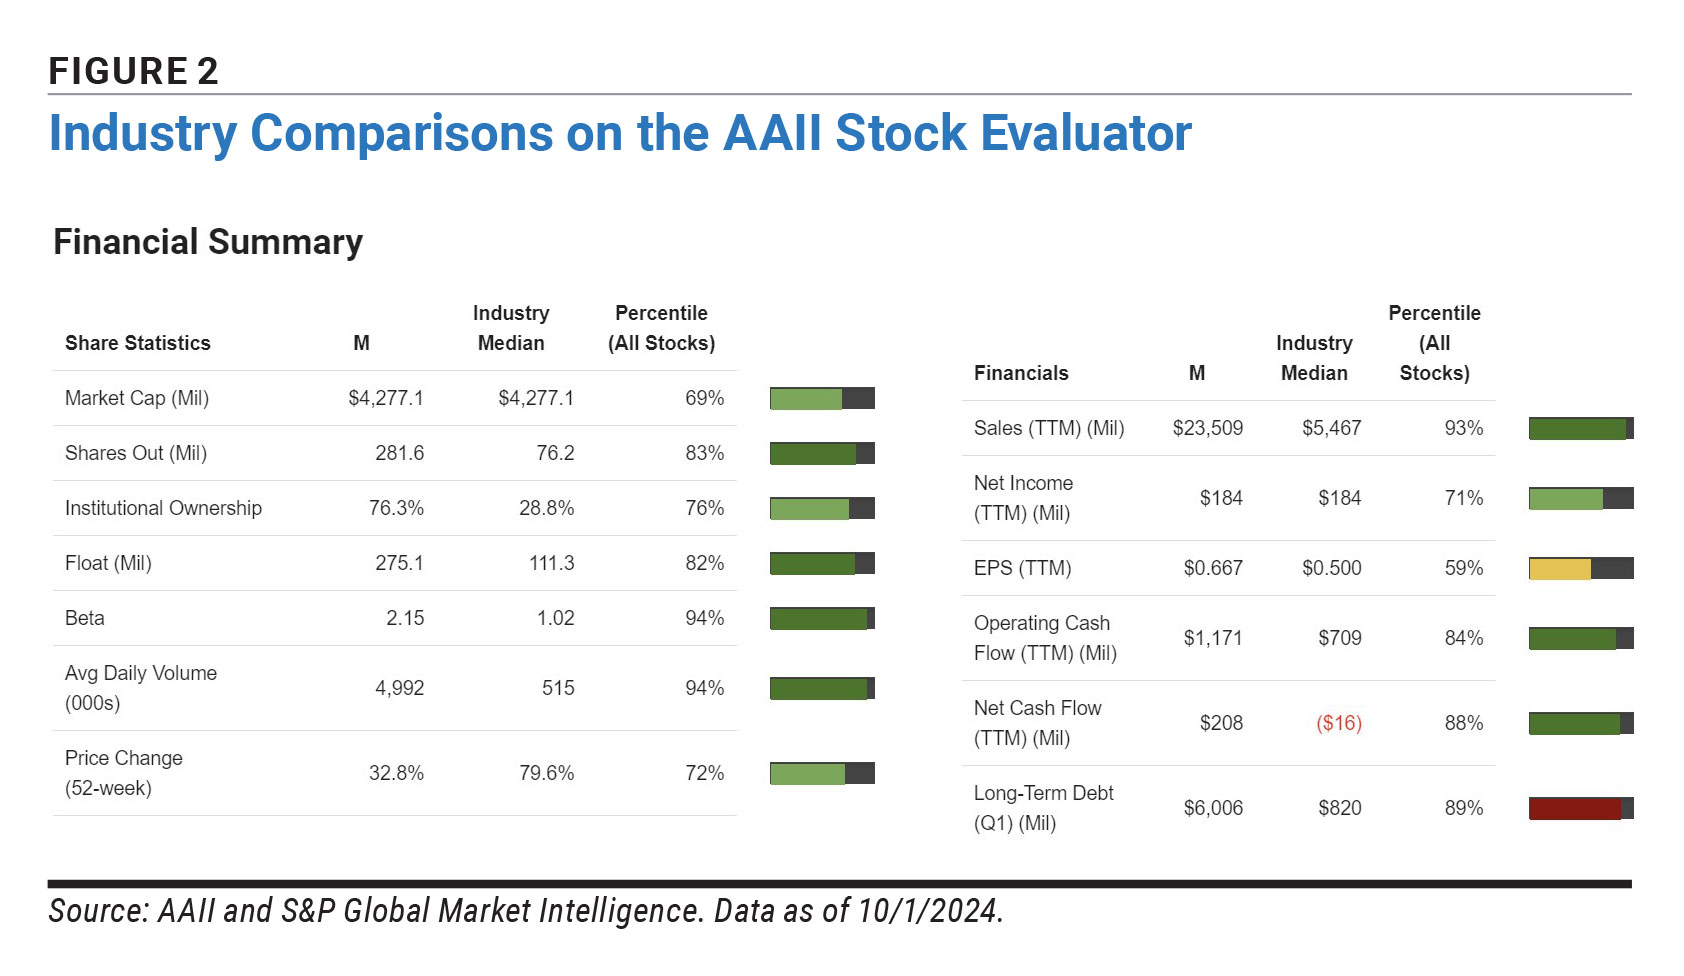
A+ Investor and AAII Platinum subscribers can find more detailed comparisons on the Valuation, Growth and Ratios tabs of the Stock Evaluator—including historical data. For valuation metrics and growth rates, you can see both industry and sector comparisons. For financial ratios, industry comparisons are shown.
Since the industries and sectors have changed, so have the comparisons. In most cases, there are more and/or different companies within a certain industry group. Sector compositions have likely changed as well.
Here is an example. The median price-earnings (P/E) ratio for the LSEG department store retailers industry group is 17.4 as I write this at the start of October. The median price-earnings ratio for the GICS broadline retail industry group is 20.8. Macy’s price-earnings ratio is 23.5. Though Macy’s looks to have less of a premium valuation relative to its peers (58th percentile versus 60th percentile previously), it is the underlying benchmark that has been revised.
Sector and Industry ETFs
We use Morningstar data for ETFs and mutual funds. Morningstar uses its own proprietary fund classification system, and funds are classified based on their holdings. Morningstar’s fund categories can still provide a helpful starting point.
Various funds track indexes relying on the GICS classifications. One way to narrow down the list of ETFs that do so is to look for those tracking sector or industry indexes from S&P or MSCI. We list the index tracked on individual ETF Evaluator pages as well as in the Overview tab of the ETF Guide.
The Consumer Discretionary Select Sector SPDR ETF (XLY) tracks the consumer discretionary sector of the S&P 500 index. While it does not track the full sector, it does provide direct exposure to large-cap stocks classified in the GICS consumer discretionary sector.
You will likely have to visit the ETF family’s website, and potentially read the ETF’s prospectus, to determine which GICS sector or industry group an ETF tracks. In doing so, look to see if the ETF seeks to match the benchmark’s performance (meaning the ETF tracks it) or seeks to beat it (meaning the ETF can veer from it). If you cannot easily determine this, chances are that the ETF does not track the particular sector or industry group.
See this issue’s Financial Statement Analysis column for more on our transition to S&P Global Market Intelligence data.

Related

Related

AAII How-To
Comparing Funds That Track the Same Index
Discussion
FREE REPORT

Get your free copy of our special
report analyzing the tech stocks
most likely to outperform the
market.
No comments have been added yet. Add your thoughts to the discussion!
You need to log in as a registered AAII user before commenting.
Log InCreate an account