


Related

AAII How-To
Financial ratios can elevate investor knowledge and create a more detailed picture about a company’s stability, competitive position and profitability.

Part of the fun of investing is learning about a company, how it fits into its industry and how it serves its clients. Beyond this headline information, financial ratio analysis can help investors form a more complete story. Taken one step further, ratios can also be used to identify a company’s strengths and weaknesses, inserting rational objectivity into investment decision-making.
Companies report financial results on their income statement, balance sheet and cash flow statement. Ratios are the thread that weaves these three financial statements together, allowing comparability between companies in the same industry and, more widely, across different industries.
One number by itself is not useful for understanding a company’s position within an industry. A clearer picture is formed by tracking ratios across multiple periods and comparing them to those of competitors to detect company and industry trends. There are four main categories for ratios: profitability, solvency, liquidity and efficiency. For the illustrative purposes of this article, we focus on the profitability and solvency ratios found on the AAII Stock Evaluator page for AGCO Corp.  (AGCO) as an example.
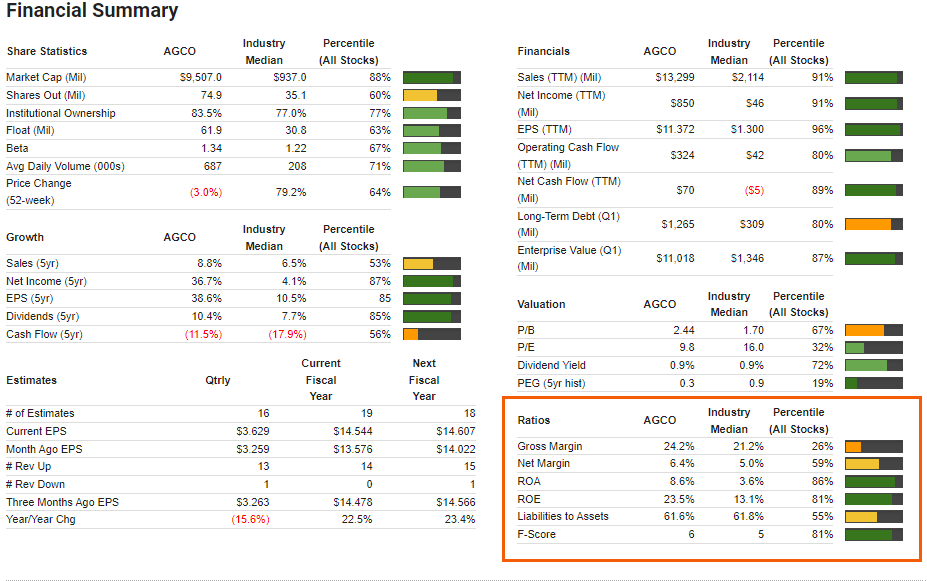
All AAII members can use the Stock Evaluator to look up the ratios discussed in this article. To access the evaluator, simply type a company’s name or ticker symbol into the search box in the top-left corner of any page on AAII.com, and then select the company name from the drop-down list that appears. Once on the Stock Evaluator page, scroll down the Snapshot page to the Financial Summary. The Ratios table is in the bottom-right corner of the summary section. As shown in Figure 1, this table provides a current snapshot of each ratio for a given company and its industry median. A percentile ranking among all stocks, including companies in other industries, is also provided.
Figure 1. AGCO Corp. Financial Summary on AAII’s Stock Evaluator
Source: AAII.com. Data as of 5/9/2023.
Profit margin ratios show how much companies are earning relative to revenue. Common metrics include gross profit margin and net profit margin. Again, the best practice is to compare these against the company’s industry peers. Gross margin is simply gross income (revenue less cost of goods sold) divided by net revenue. The ratio reflects pricing decisions as well as costs directly related to production and sales. AGCO’s gross margin of 24.2% means that it earns about $0.24 for every dollar of revenue on a gross basis. This is slightly higher than the industry median of 21.2% ($0.212 per dollar of revenue), and it ranks in the 26th percentile in the all-stock universe.
Margins will vary among industries. Companies operating in industries where products are easily replicated by other firms will typically have low margins. Industries that offer unique products, have high barriers to entry, with enhanced branding or sustainable competitive advantages may have higher margins. Margins may erode as high profits attract new entrants.
Net margin is calculated by dividing net income after taxes by revenue. It is near and dear to shareholders since it measures a firm’s ability to translate revenue into aftertax earnings. AGCO’s net margin of 6.4% means that it realizes $0.064 in net earnings out of every revenue dollar for its shareholders.
Profit margins are impacted by management decisions, competition and economic and exogenous factors. For example, a widespread drought or large currency fluctuations would impact AGCO as an agriculture equipment manufacturer that operates throughout the world.
Investors benefit when companies use their resources efficiently to create profitability. Return on assets (ROA) is calculated as net income divided by total assets. A high ratio suggests more efficiency. The median return on assets for the heavy machinery and industrial vehicles industry is 3.6%, whereas AGCO’s return on assets is 8.6%. This ratio is highly dependent upon the company’s asset base. Banks, for example, tend to carry their assets and liabilities at current value, whereas a manufacturing company’s physical plant assets are likely to be carried at historical cost. The point is that asset bases are very different across industries, which makes using this ratio to compare industries less useful.
Return on assets uses total assets in the denominator, whereas return on equity (ROE) measures net income less any preferred dividends against total shareholder’s equity. Probably the most popular profitability ratio, return on equity compares the level of income attributed to shareholders to shareholder’s equity. It accounts for debt and financial leverage. Financial leverage is like a pendulum magnifying the impact of earnings on return on equity in both good and bad reporting periods.
One way to detect the presence of leverage is to note whether there is a sizable discrepancy between return on assets and return on equity. If the numbers differ significantly, a further look at the liquidity and solvency ratios is warranted. AGCO has a return on equity of 23.5% versus a return on assets of 8.6%. The company’s liabilities-to-assets ratio of 61.6% helps to explain this difference.
Though AGCO’s debt levels are similar to its peers, its return on equity is well above the industry median of 13.1%. For every dollar of shareholder’s equity, a return on equity of 23.5% suggests that AGCO is generating $0.235 in net income.
See the AAII Stock Ideas column in this issue for a stock approach that seeks profitable companies by focusing on return on equity.
Analysis of solvency ratios provides insight into the company’s capital structure and the amount of leverage utilized. These ratios measure the ability to meet longer-term obligations such as debt repayment.
The Ratio table on the Snapshot page depicts the liabilities-to-assets ratio as a solvency measure. As noted, AGCO’s liabilities-to-assets ratio is 61.6%, close to the industry median and ranking in the 55th percentile among all stocks.
A company’s cash flow statement complements its balance sheet and income statement. An advantage of the cash flow statement is that it presents a picture of company performance unaffected by the timing or discretion of accounting methods for noncash items such as depreciation.
Two cash flow metrics are provided in the Financials table at the upper right in the Financial Summary section of the Snapshot page. Operating cash flow (aka cash from operating activities) provides a reality check of business operations. It is listed in the first section of a company’s cash flow statement. Operating cash flow adjusts net income for noncash expenses such as depreciation and amortization as well as changes in working capital. A review can augment your understanding of net income because changes in cash related to receipts and payments are detailed in cash flow from operating activities.
Net cash flow is perhaps the most telling of all metrics and is used to determine if a company has increased its cash balance or drawn it down through a combination of operating activities, investing activities and financing activities (including dividends and share repurchases). A negative number in any single period could be due to investments in expansion or the payment of debt. Continued negative net cash flow requires a thorough look at the cash flow statement.
A+ Investor and Platinum subscribers can access the Stock Evaluator’s Ratios tab to see these and other historical ratios for a given company and its peers. Current and past quarterly and annual financial statement data is provided in the Financials tab.
AAII members wishing to do a deeper dive may want to look at the company’s Form 10-Q and Form 10-K regulatory filings on the U.S. Securities and Exchange Commission’s (SEC) EDGAR website at www.sec.gov/edgar.
While ratio analysis can’t prevent all pitfalls in investing, it can elevate investor knowledge and create a more detailed picture about a company’s financial strengths and weaknesses, its competitive position and its profitability. Being able to recognize ratio trends and pair that knowledge with a deep understanding of industry forces can help investors feel more confident about picking stocks.
[Editor’s note: AGCO is held in the VMQ Stocks model portfolio, and Cynthia McLaughlin personally owns the stock.]
AAII How-To

Financial Statements


JAMES L from TN posted over 3 years ago:
BARRY J from TX posted almost 2 years ago:
You need to log in as a registered AAII user before commenting.
Log InCreate an account