


Related

Financial Statements
Switching from as-reported to standardized data can significantly enhance the quality of stock analysis; however, using standardized data has potential limitations.

Wayne Thorp leads a class in AAII's new Essential Investing Video Course. Go to https://www.aaii.com/ves for more information and to subscribe.
In the world of financial analysis, data quality and consistency are paramount. Financial statements serve as the backbone for company analysis, helping investors, analysts and corporate executives make informed decisions. Two of the most common providers of financial statement data are LSEG Data & Analytics (formerly Refinitiv) and S&P Global Market Intelligence.
On October 1, after a year of programming and testing, AAII finalized transitioning to S&P Global for fundamental company data and consensus earnings estimates on the AAII websites and in Stock Investor Pro, our fundamental stock screening and research database.
This shift impacts the “raw” company data you see as well as “derived” ratios, multiples, growth rates and A+ Stock Grades that are calculated using financial statement data.
A key difference between LSEG and S&P Global is the use of data normalization, or standardization. While LSEG provides as-reported financial statement data, S&P Global offers normalized, or standardized, data.
LSEG, our former data provider, gave us as-reported data, which represents the financial statements exactly as they are presented by the company. It reflects the original financial statement disclosures, including all the unique line items and classifications used by individual companies.
While this approach preserves the company’s reporting nuances, it can introduce inconsistencies when comparing multiple companies, industries or periods, as each company may use different accounting practices and definitions.
Standardized data, as offered by S&P Global, involves adjusting and reclassifying financial data into a consistent format. The process includes aligning line items, adjusting for accounting differences, and ensuring comparability across industries and time periods.
Standardization results in a more uniform dataset that enhances comparability and consistency, making it easier to perform cross-company or cross-industry analysis.
The easiest way to illustrate the impact of S&P Global’s data standardization is with a real-world example: Exxon Mobil Corp.  (XOM). Table 1 shows select income statement items for Exxon for the fiscal year ended December 31, 2023. The as-reported data from the company’s 10-K report is shown next to the standardized data you would see on AAII.com.
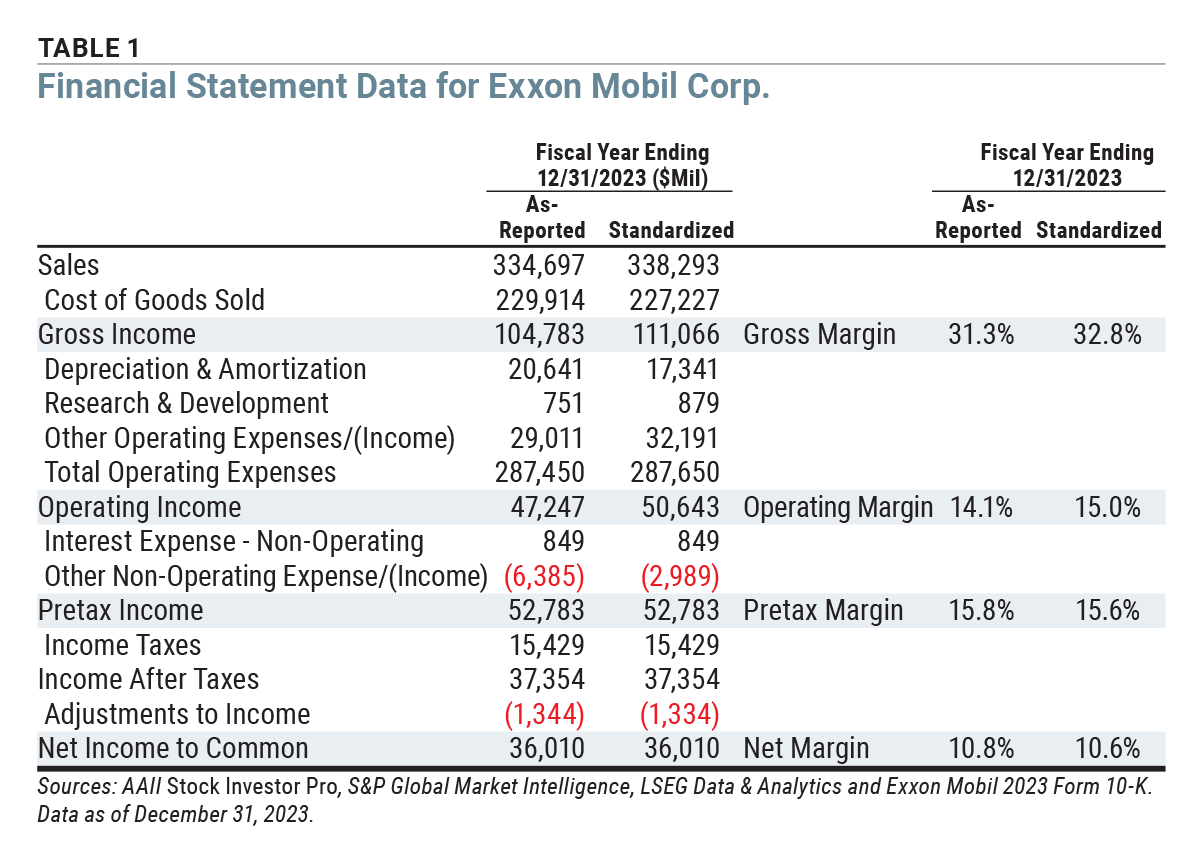
For the fiscal year ended December 31, 2023, Exxon reported “sales and other operating revenue” of $334,697 million. S&P Global provides total revenue for the period of $338,293 million. This includes additional “other income” of $3,500 million, deducts the net gain on asset sales of $513 million and adds back the $609 million currency translation loss for the year. These adjustments result in an additional $3,596 million in revenue for Exxon’s latest fiscal year.
LSEG reported cost of goods sold (COGS) for Exxon of $229,914 million, which is the sum of crude oil and product purchases ($193,029 million) and production and manufacturing expenses ($36,885 million). The standardized cost of goods sold from S&P Global is the $229,914 million reported by Exxon less $2,687 million of other non-income tax, for a total of $227,227 million.
Differing sales and cost of goods sold figures between as-reported and standardized data leads to gross income for Exxon of $104,783 million and $111,066 million, respectively.
As a result, the gross margin for Exxon is slightly higher for the standardized data (32.8%) compared to the as-reported data (31.3%).
LSEG’s as-reported depreciation and amortization expense for Exxon was $20,641 million in 2023. From this amount, S&P Global added back Exxon’s $3,300 million in asset write-downs, lowering the standardized depreciation and amortization expense to $17,341 million. In effect, S&P Global does not view asset write-downs as operating expenses.
LSEG designated Exxon’s $751 million “exploration expenses, including dry holes” as research and development costs in 2023. S&P Global used the $879 million of research and development expenses Exxon reported in its “Notes to Condensed Consolidated Financial Statements” from its 2023 Form 10-K filing.
The balance of other operating expenses for Exxon on an as-reported basis is $29,011 million, which it reported as “other taxes and duties.” As part of S&P Global’s standardization process, $493 million for other taxes included in selling, general and administrative (SG&A) expenses and $2,687 million for other taxes included in production and manufacturing expenses are added to the as-reported number.
In aggregate, Exxon reported operating expenses of $287,450 million in 2023, compared to $287,650 million on a standardized basis.
Even though standardized operating expenses were higher in 2023 than as-reported operating expenses, standardized revenue was higher as well. Therefore, standardized operating income was $50,643 million, versus $47,247 million on an as-reported basis. This translates to a slightly higher operating margin using standardized data compared to as-reported data, 15.0% versus 14.1%.
Exxon’s 2023 non-operating interest expense is the same for as-reported and standardized data: $849 million.
As we progress down the income statement, the need arises for as-reported and standardized data to reconcile. For Exxon, other non-operating expense/(income) is where this takes place. Exxon reported income from equity affiliates of negative $6,385 million in 2023 and put it at the top of the income statement as part of total revenues and other income.
LSEG assigns this to other non-operating income, boosting operating income to arrive at pretax income of $52,783 million.
S&P Global’s standardization process reduces income from equity affiliates by $3,300 million—the amount of asset write-downs for the year—reversing the adjustment it made to depreciation and amortization earlier on the income statement that boosted operating income. This is S&P Global assigning the write-down of assets as a non-operating expense. The lower non-operating income leads to the same pretax income level of $52,783 million. However, because S&P Global has a slightly higher revenue figure for Exxon, the pretax margin using standardized data is slightly lower than that using the as-reported data: 15.6% compared to 15.8%.
For the rest of the income statement, the same figures are reported using as-reported and standardized data for income taxes and adjustments to income. The income tax expense of $15,429 million matches what Exxon reported in its Form 10-K. The adjustment to income is the portion of a consolidated subsidiary’s income applicable to common stock not owned by Exxon (minority interest) of $1,334 million.
In the end, the bottom-line net income to common value of $36,010 million is the same whether you are using as-reported or standardized data. However, again, since the revenue figure is higher using standardized data, the standardized net margin of 10.6% is slightly lower than the 10.8% figure derived using as-reported data.
While the final net income for Exxon remains the same between as-reported and standardized data, the differences in how revenue, expenses and certain line items are categorized highlight the impact and value of standardized financials.
By making adjustments such as excluding asset write-downs from operating income or incorporating additional revenue components, S&P Global’s data standardization provides a more consistent comparison across companies. These refinements can influence key financial metrics like operating margin and net margin, allowing for a clearer evaluation of a company’s financial performance in relation to its peers.
One of the primary advantages of using standardized data is the ability to seamlessly compare financial statements across companies and industries. S&P Global’s normalization process ensures that data from different companies is adjusted for variations in accounting methods, terminology and presentation styles.
For example, while one company might report “depreciation and amortization” as a single line item, another might separate them. Standardized data merges these variations, providing an apples-to-apples comparison and making it easier to evaluate performance metrics like earnings before interest, taxes, depreciation and amortization (EBITDA), margins or return on assets (ROA).
As-reported data often contains inconsistencies and discrepancies that stem from differing accounting policies, such as how companies treat leases, revenue recognition or non-operating items. These variations can distort financial ratios and metrics, leading to inaccurate conclusions.
The switch to standardized data addresses these issues by applying consistent accounting treatments, which increases the reliability of your financial analysis. For instance, S&P Global adjusts for accounting changes such as the adoption of new International Financial Reporting Standards (IFRS) or generally accepted accounting principles (GAAP), ensuring the data reflects true economic performance.
Standardized data facilitates advanced quantitative analysis, such as screening for investment opportunities, building financial models or conducting sector-wide trend analysis. With consistent and comparable data, analysts can develop more robust models that yield actionable insights.
For example, when building sector-specific financial models, using standardized data ensures that key ratios and metrics are based on comparable inputs, leading to more accurate forecasting and valuation models.
Despite the advantages of switching to standardized data, there are some considerations to be aware of.
Normalized data can sometimes mask the unique characteristics and nuances of a company’s financials. As-reported data offers detailed insights into how a company operates, which can be critical for understanding a company’s specific business model or accounting practices.
For instance, companies might disclose detailed segment reporting or unusual items that could provide valuable insights into their operations, which might be aggregated or standardized in a normalized dataset.
While standardized data enhances comparability, there’s a risk of overreliance on it without understanding the underlying adjustments made. Investors should always be aware of the normalization methodologies and the potential impact on financial metrics, ensuring that the data reflects economic reality.
Switching data providers will require time to understand the difference between normalized and as-reported data. Adapting to the nuances of S&P Global’s standardized data can involve a learning curve, especially in understanding how financial line items are adjusted and classified.
Shifting from as-reported financial statement data to standardized data can impact “derived” data such as financial ratios, multiples and growth rates. It may also affect financial analysis such as valuation models, trend analysis and risk assessment.
Standardized data adjusts for inconsistencies across companies, providing more comparable metrics. However, these adjustments might exclude specific items that some companies report, potentially leading to differences in key ratios like the price-earnings (P/E) ratio, debt-to-equity ratio or profit margins.
Growth rates may also be affected, as standardized data aims for consistency over time, which may smooth out fluctuations or exceptional items that would otherwise influence growth trends in as-reported data.
The accuracy of valuation models, such as discounted cash flow (DCF) analysis or comparable company analysis, relies heavily on consistent financial inputs. Using standardized data helps create more accurate valuation multiples (e.g., price-earnings ratio, enterprise-value-to-EBITDA ratio) by ensuring that the denominator is consistent across companies.
This consistency leads to more credible and actionable valuation insights, ultimately helping investors make better investment decisions.
Standardized data from S&P Global enables more reliable trend analysis over time, as it adjusts for changes in accounting standards or reporting practices that may distort historical comparisons.
This capability is particularly important when conducting long-term trend analysis to assess a company’s growth trajectory, profitability or financial health.
Standardized data can improve risk assessments by providing a clearer picture of a company’s leverage, liquidity and solvency.
For example, debt-related metrics, such as the debt-to-equity ratio or interest coverage ratio, become more meaningful when based on standardized figures that account for different definitions of debt across companies.
With our transition to S&P Global, our sector and industry classifications will now follow the Global Industry Classification Standard (GICS), replacing The Reference data Business Classification (TRBC) system. This shift aims to enhance the consistency and depth of the data you access. GICS is a widely recognized system that will align our classifications with industry standards, providing better insights and comparability.
Our industry classifications took a broader view in the past, as we are moving from 154 industry classifications for TRBC to 74 for GICS. Under the old classifications, some industries only comprised a handful of companies. Industry median values are more meaningful by taking a higher-level view of industry classifications.
See the AAII How-To column in this issue for more on how the sector and industry classification change impacts data you see on AAII websites and in Stock Investor Pro.
You may also notice a change in the stock universe used for the AAII Stock Screens, Stock Evaluator, A+ Stock Grades Screener and Custom Stock Screener.
As before, our stock universe captures companies listed on U.S. stock exchanges with recent trading histories and financial filings, ensuring that our database tracks companies with current financial data that are actively traded.
In addition, we have now instituted a minimum share price of $1.00 for stocks trading over the counter (OTC) to improve the quality of data, analysis and investment decisions.
Switching from LSEG’s as-reported data to S&P Global’s standardized data can significantly enhance the quality of financial analysis. The standardized approach offers improved comparability, accuracy and efficiency, allowing investors to perform more insightful and actionable company analyses.
However, it’s essential to recognize the potential limitations of standardized data, such as the loss of granularity, and to ensure that any analysis is grounded in an understanding of both the normalized and as-reported figures.
The transition represents an opportunity to leverage the benefits of consistency and enhanced analytical capabilities, ultimately leading to more informed investment decisions, improved financial modeling and a deeper understanding of company performance.
As the financial landscape continues to evolve, embracing standardized data sources like that offered by S&P Global will become increasingly crucial for staying competitive and making data-driven decisions.
Our next financial statement analysis article on financial ratios will appear in the January 2025 AAII Journal. All articles in this series can be accessed at AAII.com in the AAII Journal article index.
Financial Statements

Investor Professor


ROBERT A from NC posted almost 2 years ago:
Wayne T from IL posted almost 2 years ago:
BARRY J from TX posted almost 2 years ago:
Wayne T from IL posted almost 2 years ago:
You need to log in as a registered AAII user before commenting.
Log InCreate an account