


Related
First Cut Stocks
Stocks that reward shareholders by paying dividends, lowering the number of shares outstanding and reducing debt.
by John Bajkowski | May 2025

Focusing on companies that pay dividends and then reinvesting the dividend payments is a reasonable investing approach. However, it ignores the other shareholder-oriented actions companies can take to boost their value. There are essentially five choices companies have for deploying capital:
The basic shareholder yield measure combines the impact of the cash dividends and share repurchases to better capture the value of capital returned to shareholders than dividend yield alone. Investment expert Mebane “Meb” Faber advances the shareholder yield to include the impact of change in debt.
Faber is a cofounder and the chief investment officer of Cambria Investment Management. He manages Cambria Investment’s exchange-traded funds (ETFs) and separate accounts. His research has covered a wide range of investment strategies and topics, including shareholder yield, global valuations, global asset allocation, endowment investing, venture capital and angel investing, behavioral finance, and trend and momentum following.
AAII introduced Faber’s shareholder yield strategy in the August and September 2020 issues of the AAII Journal and developed a screening filter to capture the spirit of Faber’s shareholder yield investing focus. Faber has recently revised his book “Shareholder Yield: A Better Approach to Investing” (Second Edition, The Idea Farm, 2024), which can be downloaded for free from ShareholderYield.com. In his book, Faber analyzes portfolios based on various cash flow metrics and finds that portfolios of companies with high shareholder yields outperform both broad market indexes and high dividend yield portfolios by a substantial margin.
Faber states that the most holistic way to approach the topic of yield investing is to seek companies that pay dividends, repurchase shares and pay down debt.
AAII developed a shareholder yield filter inspired by Faber’s approach that screens for exchanged-listed dividend-paying firms with positive dividend and buyback yields. Next, we use quality and leverage characteristics to exclude risky stocks and seek out companies reducing their debt. Lastly, we utilize valuation factors such as price relative to free cash flow per share and companies in the top quintile of shareholder yield to screen for stocks trading at attractive relative valuations.
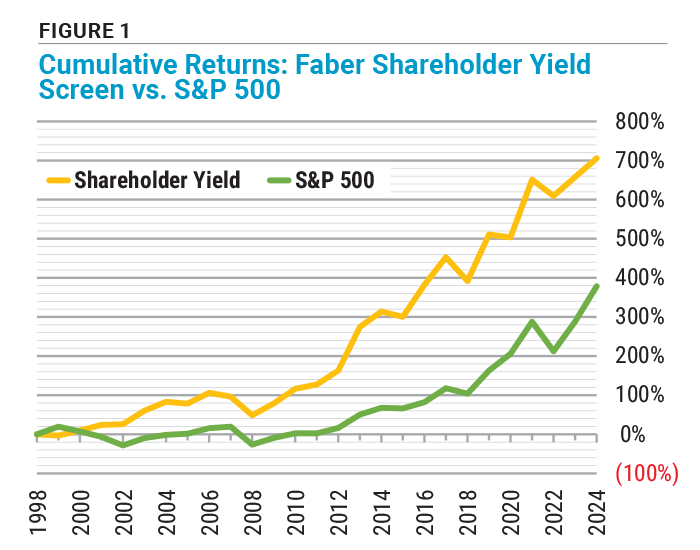
The long-term price performance of the AAII Shareholder Yield screen, assuming calendar-year rebalancing, has been strong. The screen has an annual price return of 8.2% from 1998 through 2024, compared to an annual price gain of 6.1% for the S&P 500 index over the same period. Our backtested results are shown in Figure 1.
The filtering process begins with a broad universe of exchange-listed stocks with market capitalizations (shares outstanding times price per share) for the latest reported fiscal quarter of at least $200 million to help ensure a minimum level of trading liquidity. Real estate investment trusts (REITs) are excluded because of their unique organizational structure and noncomparable financial statements.
Dividend yield measures dividend payments relative to the share price. Dividends and their reinvestments have historically provided higher cumulative returns with lower levels of volatility versus non-dividend-paying stocks over long-term holding periods. Faber states that while it is evident that dividends contribute a major portion of returns to an entire stock market over time, research also indicates that higher dividend-yielding stocks have performed better than stocks with little to no yield.
The Faber-inspired shareholder yield screen looks for companies both currently paying a dividend and possessing a recent positive trend in the growth of their dividends per share payment.
The AAII Faber approach requires a positive buyback yield. There is sufficient evidence that shares of companies that aggressively repurchase their shares have better returns. According to academic studies, stocks with high buyback yields outperform stocks with low buyback yields. When a company reduces the number of outstanding shares, investors holding the remaining shares gain a slightly larger proportional claim to the company and its profits. Share buybacks also signal that management thinks the stock is undervalued and the company is repurchasing shares at a discount.
While there are a couple of ways to calculate the buyback yield, the easiest is to look at the change in the number of outstanding shares. A stock’s buyback yield is determined by comparing the average shares outstanding for one fiscal period against the average shares outstanding for another fiscal period. The percentage change in the number of shares is the buyback yield. Note that the signs are reversed, so a positive buyback yield indicates that the average number of shares outstanding has declined.
Another component of Faber’s shareholder yield is the debt paydown yield. We do not include the debt paydown yield in the AAII shareholder yield calculation, but we do require companies to have stable or decreasing levels of debt. The screen looks for decrease in debt—both on a year-over-year basis (the same quarter in sequential fiscal years) and on a quarter-to-quarter basis (i.e., the first quarter to the second quarter of the same fiscal year).
One risk with debt is that a company will not generate enough cash flow to cover the interest payments during challenging times. The interest coverage ratio can help judge a company’s ability to pay its obligations. The larger and more stable the ratio, the lower the risk of the company defaulting. We screen for a positive interest coverage ratio and for an interest coverage ratio greater than or equal to the company’s industry median over the same period.
An examination of the actual cash generated by the firm is critical for a long-term investor. A filter requiring positive free cash flow per share for the past 12 months attempts to capture whether the passing firms generate enough cash to pay dividends, repurchase shares and pay down debt.
A filter requiring a price-to-free-cash-flow (P/FCF) ratio less than or equal to the average price-to-free-cash-flow ratio of the universe of stocks is used to signal a potentially undervalued stock based on a company’s ability to generate cash.
AAII’s Stock Investor Pro fundamental stock screening and research database defines shareholder yield as the sum of the dividend yield and the buyback yield. Thus, if a company is paying a 5% dividend yield and has a buyback yield of 10%, its shareholder yield would be 15%. The theory is that stocks with higher shareholder yields are more attractive than those with lower ones.
The AAII Faber shareholder yield approach includes a final requirement restricting the results to those companies in the top quintile of shareholder yield. This requirement translated to a minimum shareholder yield of 3.3% when we ran the screen.
The shareholder yield is inversely related with value: Higher shareholder yields imply more attractive valuations. Because the buyback yield is the change in the number of shares outstanding, the shareholder yield can be either positive or negative. A negative shareholder yield would occur when the percentage increase in the number of shares outstanding exceeds the dividend yield.
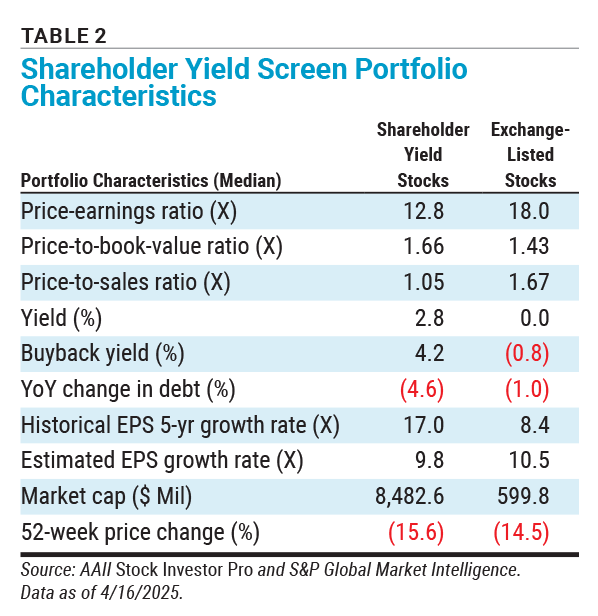
Sixty-five companies passed the shareholder yield screen using data as of April 16, 2025. The 30 companies with the highest shareholder yields are presented in Table 1. The characteristics of the stocks currently matching the shareholder yield approach are presented in Table 2.
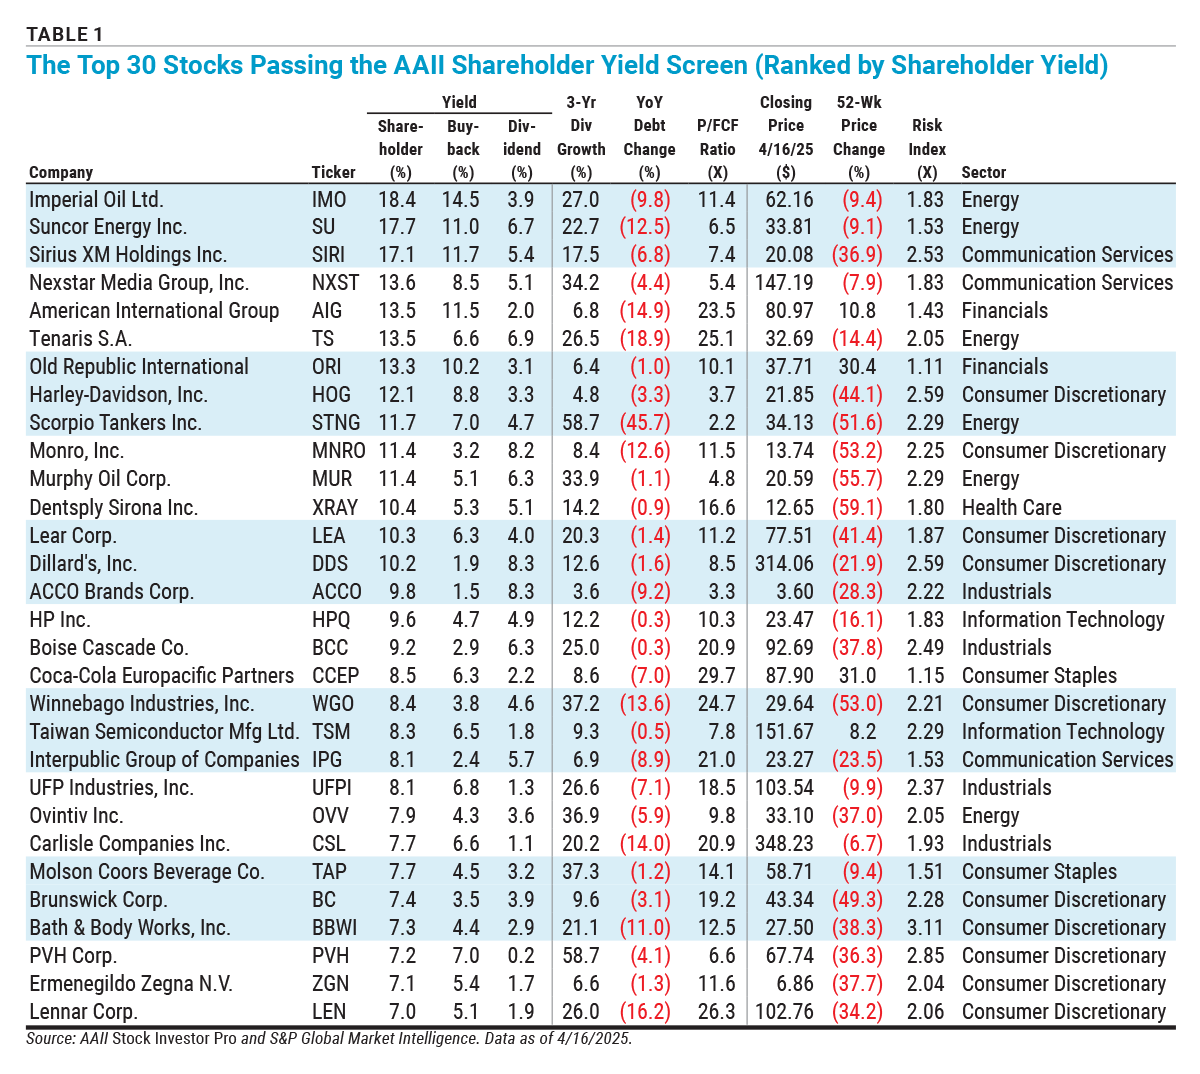
In reviewing the passing companies and the portfolio characteristics table, it is helpful to keep in mind that shareholder yield is the sum of dividend yield and buyback yield, and the screen requires positive values for both individual components.
For example, Taiwan Semiconductor Manufacturing Co. Ltd.  (TSM) has a shareholder yield of 8.3%, achieved through a share reduction of 6.5% (buyback yield) and a current dividend yield of 1.8%. Its dividend has expanded at a 9.3% annual rate over the last three fiscal years. The sum of short- and long-term debt has decreased 0.5% over the last year. Its price-to-free-cash-flow ratio is 7.8, well below the average of 36.4 for all companies. While the share prices of most companies passing the shareholder yield screen are down over the last 52 weeks (–15.6%), Taiwan Semiconductor is up 8.2%. However, its share price volatility over the last three years has been quite high, with a risk index of 2.29. The risk index uses a baseline value of 1.00, which denotes average risk, meaning the stock experiences the same level of volatility as the S&P 500 over the last 36 months.
AAII’s shareholder yield strategy employs our interpretation of Faber’s quantitative methodology to select U.S.-listed companies that show strong characteristics in returning free cash flow to their shareholders. Faber notes that positive free cash flow has long been emphasized by investors as a key predictor of a company’s strength. Companies that pay cash dividends—one indication of strong free cash flow—have historically outperformed the broader market. However, focusing strictly on dividend payments misses two key indicators of strong free cash flow: net share repurchases and net debt paydown. Faber believes that a focus on all three factors helps identify companies that offer strong free-cash-flow characteristics.
First Cut Stocks

AAII Stock Ideas
Portfolio Strategies

DAVE G from TX posted over 1 year ago:
SCOTT J from DEU posted over 1 year ago:
PAUL K from IN posted over 1 year ago:
Hugh P from WA posted over 1 year ago:
JOHN F from FL posted over 1 year ago:
BARRY J from TX posted over 1 year ago:
Yaroslaw M from WA posted over 1 year ago:
HAROLD S from TX posted over 1 year ago:
You need to log in as a registered AAII user before commenting.
Log InCreate an account