


Related

AAII How-To
While stock yields are often associated with dividends, they can take multiple forms, such as earnings yield or shareholder yield.

Yield is a measure of the income return on an investment. A stock’s yield is a snapshot of how much income the stock generates relative to its price.
The yield realized over a stock’s holding period can change over time and may significantly differ from the yield at purchase as well as the yield available to a new buyer today. This contrasts with a bond’s coupon (interest) rates, which are typically fixed and predictable over the life of the bond.
Furthermore, while stock yields are often associated with dividends, they can take multiple forms—such as earnings yield or shareholder yield. These yields offer different insights than the dividend yield does.
For income-focused investors, especially retirees, dividend yields serve as a quick indicator of potential cash flow. They also provide a useful comparison tool, allowing investors to contrast income potential across sectors, individual stocks or even other asset classes like bonds.
The “bird in the hand” theory suggests that investors prefer the certainty of dividend payments over the potential of future capital gains. Dividends are seen as less risky than potential stock price appreciation.
The annual dividend payment is typically calculated using the indicated dividend—that is, the most recent quarterly dividend multiplied by four. The dividend yield shows, as a percentage, how much income can be expected relative to the current stock price. If a stock’s price rises much faster than its dividend, the yield can fall to a level indicative of a high valuation. This, in turn, can suggest that the stock is at greater risk of a decline. Conversely, if the dividend yield rises to a historically high level, the stock is considered undervalued and may be poised for a run-up in price, provided the dividend is considered sustainable.
Besides stock price, the dividend yield is also affected by dividend increases or cuts. Adding the dividend yield to your capital gains allows you to calculate the total return.
The current, or trailing, dividend yield is based on the past 12 months of dividend payments, whereas the indicated (aka indicative) dividend yield is based on expected future dividend payments.
Consider Company A. It just paid a dividend of $0.50 per share, and its current market price is $45.63 per share. The stock’s past four dividend payments were $0.40, $0.40, $0.40 and $0.50 per share.
The current dividend yield is calculated by summing the past four dividends paid and dividing by the current share price: ($0.40 + $0.40 + $0.40 + $0.50) ÷ $45.63 = 3.7%.
The indicated, or leading, dividend yield is calculated by multiplying the most recent dividend by four, then dividing by the current share price: (4 x $0.50) ÷ $45.63 = 4.4%. This is what an investor buying one share today would earn.
Each yield offers a slightly different insight. The current dividend yield can help investors understand the historical stability. The indicated dividend yield can help investors plan cash flows, but it comes with some forecasting risk. Most quoted dividend yields are indicated yields.
The AAII Stock Evaluator, available to all AAII members, provides dividend yields as well as compounded dividend growth rates for over 4,000 dividend-paying stocks (Figure 1). Investors can use this information to compare a stock to its sector and industry. CF Industries Holdings Inc.  (CF) is used as an example due to its history of paying and raising its regular quarterly dividend.
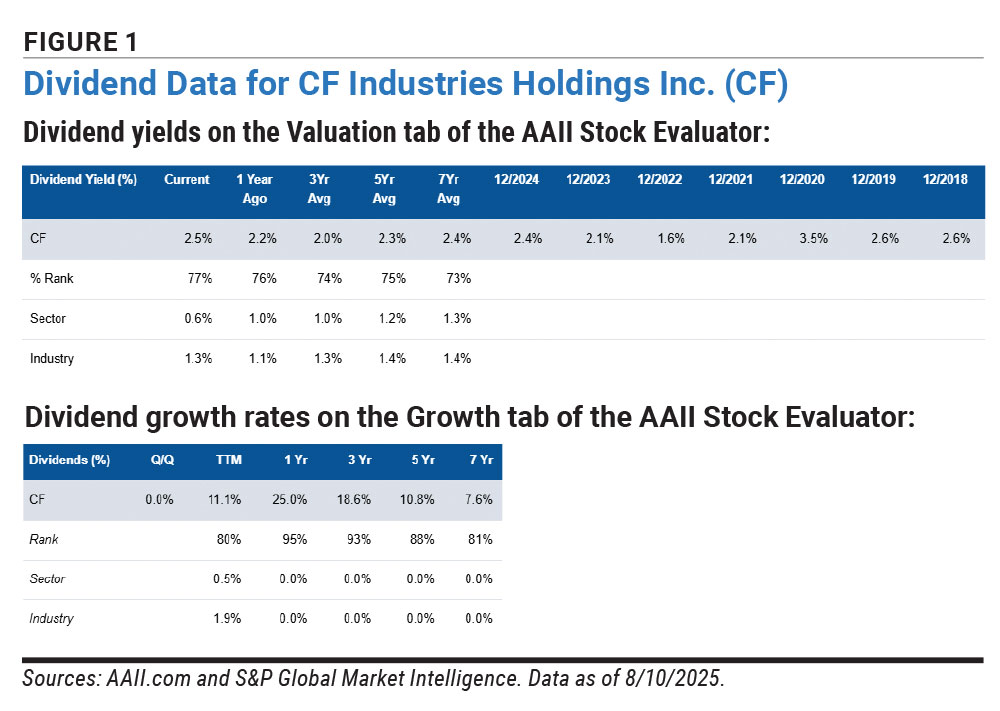
You can access this information by typing a company’s name or ticker symbol into the search box on the top of any page on AAII.com. Once on the Stock Evaluator page, click on the Valuation tab and scroll down to the Dividend Yield section. Select the Growth tab to see the stock’s current and historical dividend growth rates.
As a company raises its dividend over the years, an investor’s income stream grows—even if additional shares are not purchased. For example, if you bought 200 shares at $50 each ($10,000 total) with a $1.50 per share annual dividend, the yield would be 3.0%. If the dividend grew to $3.00 per share, you’d now earn $600 annually—a 6% yield based on your original cost.
This calculation is limited because it doesn’t reflect the yield another investor would receive if they bought the same stock today.
The earnings yield—earnings per share divided by price—is the inverse of the price-earnings (P/E) ratio. While the price-earnings ratio tells you how much investors are paying for $1 of earnings, the earnings yield tells you how much you earn for every $1 you invest.
Higher earnings yields may indicate that a stock is undervalued. The earnings yield is also useful for comparing stocks to bond yields or other investment options to gauge relative attractiveness.
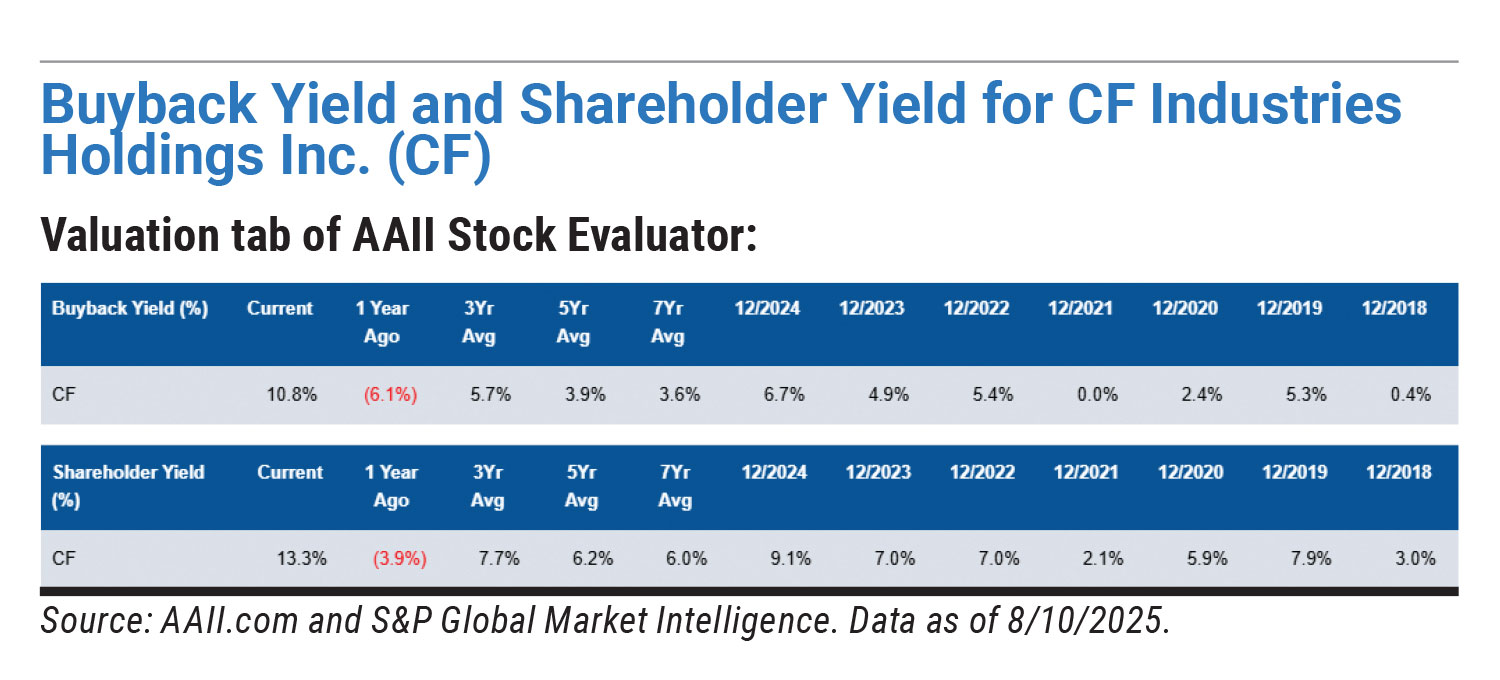
The shareholder yield is the sum of a stock’s dividend yield and buyback yield. Positive buyback yields indicate a reduction in the number of shares outstanding. A stock’s buyback yield is determined by comparing the average number of shares outstanding for the current fiscal period with the average number of shares outstanding during the prior-year fiscal period. Unlike dividends, which can create a taxable event for shareholders, corporate share buybacks are reflected in the company’s share price. This makes buybacks a tax-efficient way to return value to investors alongside regular dividend payments.
The buyback yield can be positive (a reduction in shares outstanding) or negative (an increase in the number of shares outstanding). Since a company can’t take back dividends, dividend yields are never negative.
The AAII Stock Evaluator reports current and historical numbers for both buyback and shareholder yield on the Valuation tab.
Investors demand higher dividend yields when they perceive higher levels of risk. The high yield is viewed as compensation for the chance that the current stream of dividend income will not continue in the future. Higher yields may also be compensation for the risk of the company encountering financial difficulties, thereby leading to a falling stock price. Declining earnings are also a red flag.
By boosting earnings per share through share reduction rather than genuine earnings growth, buybacks can mask operational weaknesses. Pay close attention to companies that fund buybacks with borrowings.
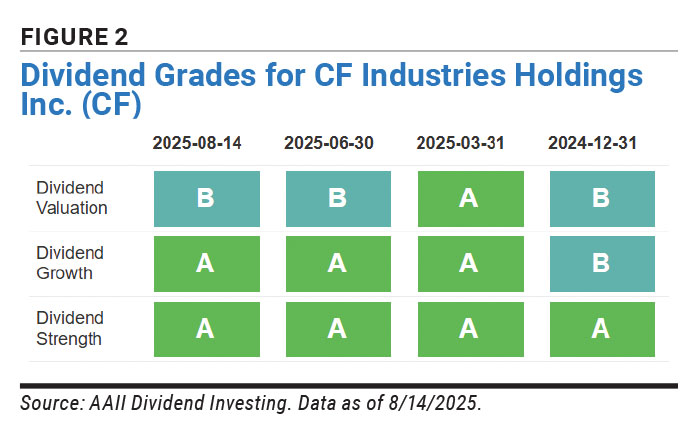
The AAII Dividend Investing (DI) model portfolio uses its Dividend Strength Grade to help select stocks that are more likely to maintain and grow dividends over time. A letter grade (A–F) is assigned based on a stock’s Dividend Strength Score (Figure 2).
A stock’s yields should be used in context with other relative and fundamental valuation measures, not as a stand-alone metric. AAII’s My Portfolio tool shows dividend yields for all the stocks in your portfolio.
The DI model portfolio holds 24 dividend-paying stocks. The site’s Dividend Grader gives you insights into dividend valuation, growth and strength for any dividend-paying stock.
AAII How-To

ETFs and Mutual Funds

AAII Stock Ideas

You need to log in as a registered AAII user before commenting.
Log InCreate an account