


Related

AAII How-To
Low volatility funds aim to reduce risk and deliver stronger results during market downturns or periods of slowing economic growth.

Roller coasters, with the anticipation felt during the slow climb up and the trepidation felt during the fast descent, are a common metaphor for market volatility. With monetary policy in flux and macroeconomic uncertainty running high, many investors are on the defense these days and turning to strategies that aim to provide stability without giving up long-term growth potential.
The objective of low volatility mutual funds and exchange-traded funds (ETFs) is to reduce risk and deliver stronger results during market downturns or periods of slowing economic growth. While these funds can help reduce overall volatility over longer time frames, they do not perform well in all market conditions.
Low volatility refers to stocks that experience smaller-than-average price fluctuations, or lower risk as measured by standard deviation. The roots of low volatility mutual funds and ETFs are both academic and market-driven. The low volatility anomaly is the observation that low-risk stocks tend to produce better risk-adjusted returns than high-risk ones. The finding is counterintuitive to the notion that higher volatility stocks should outperform lower volatility stocks, with investors being compensated for the additional risk taken.
Factor-based “smart beta” strategies helped move the low volatility factor from academic theory into widespread use. In the aftermath of the Great Recession, investors became more attuned to downside risk, fueling interest in strategies designed to temper volatility while maintaining equity exposure.
Both low volatility and minimum volatility strategies are generically referred to as “low volatility.”
Low volatility strategies typically rank stocks in an index by their historical volatility or standard deviation of returns over a specific look-back period such as 12 months.
Minimum volatility strategies construct portfolios that minimize total portfolio volatility by considering both stock volatility and the correlation between stocks. (Correlation measures the extent to which stocks move in tandem relative to each other.) The mix of stocks that results in the lowest overall portfolio volatility may still include some high volatility holdings if their correlations tend to offset each other.
Managed volatility strategies dynamically manage risk, shifting in and out of cash and fixed-income securities to stay within a given risk target. Portfolio risk is actively managed over time rather than just based on stock selection.
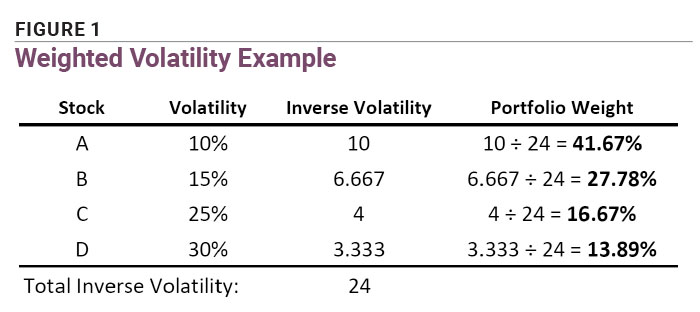
Weighted volatility portfolios weight stocks based on their individual volatility. Each stock is assigned a weight that is inversely proportional to its volatility. Lower volatility stocks receive higher weights. Figure 1 gives a simplified example, showing calculated weights for a portfolio of four stocks with different levels of volatility.
Low volatility mutual funds and ETFs are found in Morningstar’s equity blend or value categories, grouped by market capitalization and whether they are U.S., international or global funds.
We used AAII’s Mutual Fund and ETF Screeners to identify low volatility funds. Among no-load, noninstitutional mutual funds, only three low volatility funds are available in share classes that individual investors can purchase (Table 1). Of the three shown, the Fidelity U.S. Low Volatility Equity fund (FULVX) is available for purchase through Charles Schwab but not currently offered through Vanguard or to investors who do not use Fidelity’s wealth management service. All three are actively managed.

Download the Excel spreadsheet for Table 1.
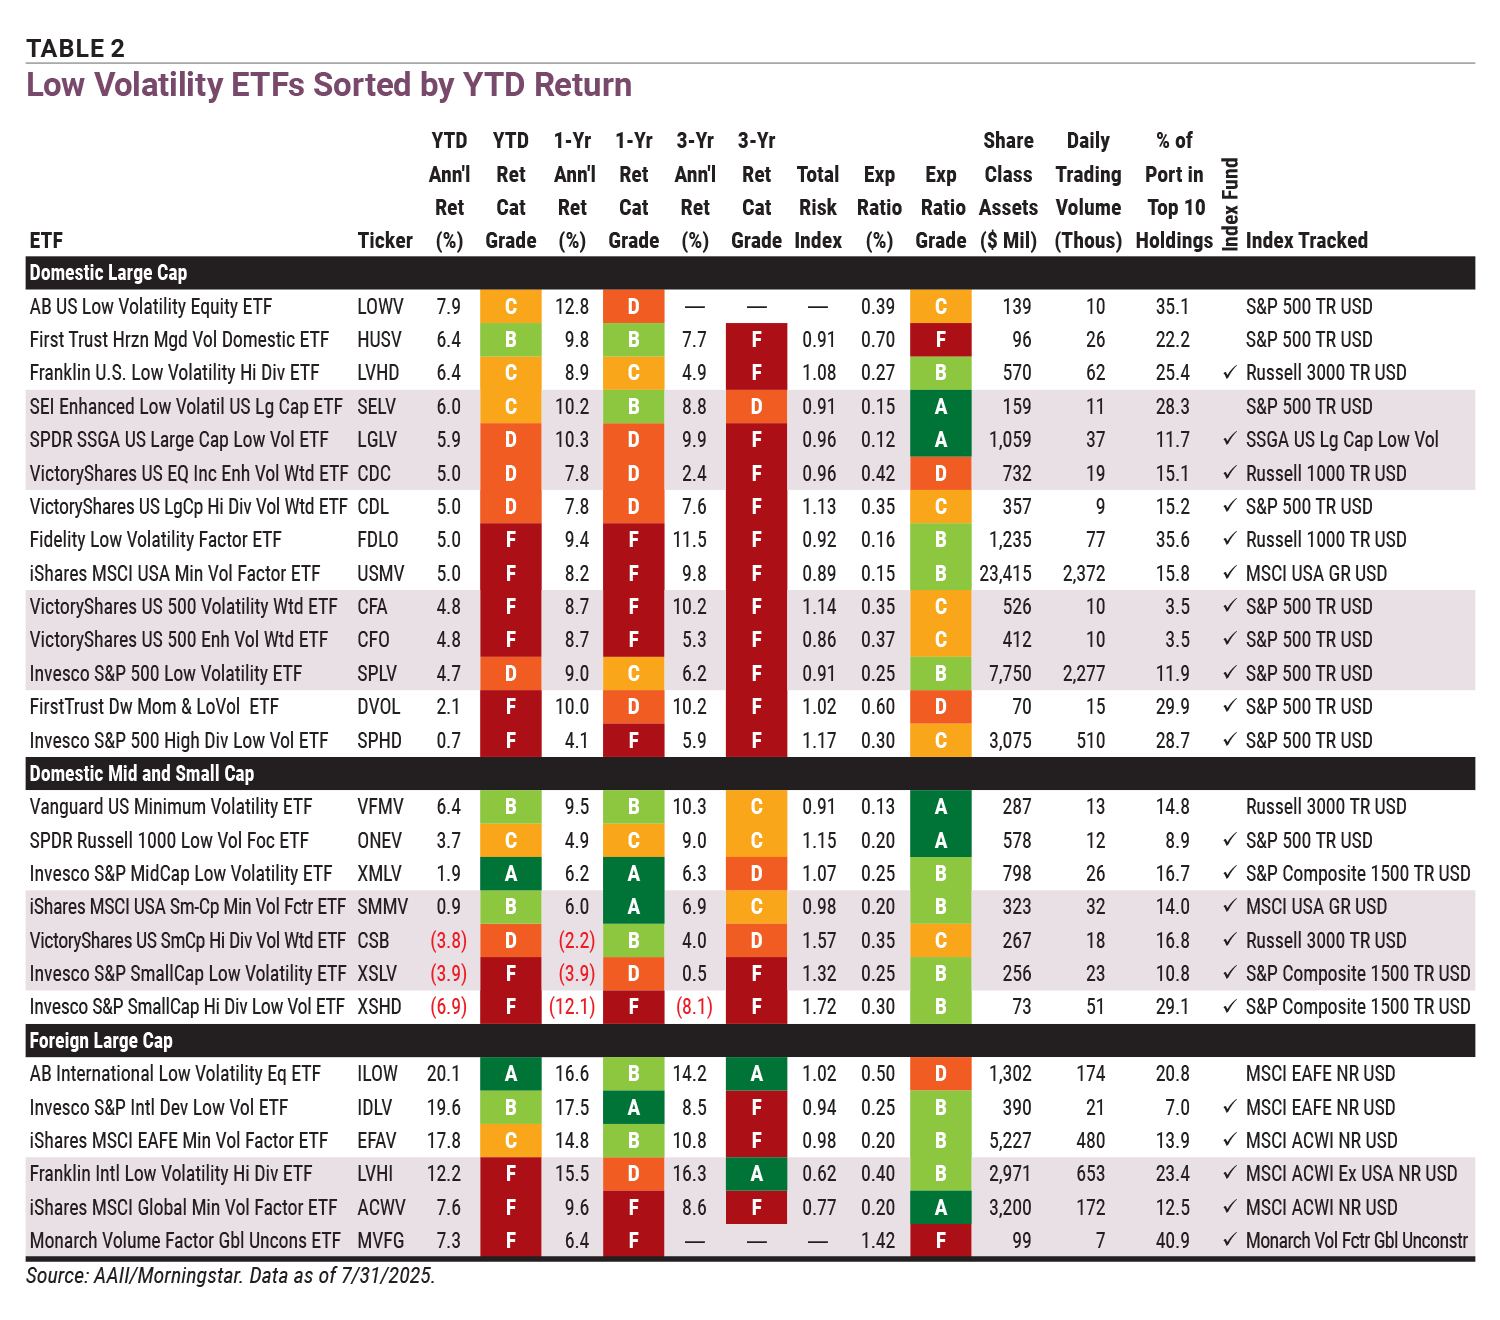
The low volatility ETFs in Table 2 were required to have an average daily trading volume greater than 5,000 and share class assets greater than $50 million. From there, we sorted by year-to-date return within broad categories.
The mutual funds presented in Table 1 vary in strategy. This is reflected in their holdings and benchmark indexes.
The Vanguard Global Minimum Volatility Admiral fund  (VMNVX) is designed to reduce overall portfolio volatility relative to the global equity market. It is a global large blend fund that offers broad diversification and has the lowest expense ratio of the three funds.
Fidelity U.S. Low Volatility Equity focuses mostly on U.S. stocks, using fundamental and quantitative methods to lower volatility. It has a small number of assets under management (AUM) and the highest portfolio turnover (84%) of the funds shown in Table 1.
The Volumetric fund (VOLMX) takes a different approach by offering tactical flexibility. It uses a proprietary trading system to adjust stock and cash allocations based on market signals. Unsurprisingly, this fund has an above-average expense ratio. The Volumetric and Fidelity U.S. Low Volatility Equity funds are both in the large blend category.
All three mutual funds have weak performance that is below their respective category averages on a year-to-date basis as well as over the one- and three-year periods.
Vanguard Global Minimum Volatility Admiral holds 222 stocks, compared to the 10,000 stocks held in its benchmark FTSE Global All Cap index. Nearly 59% of the fund’s holdings are U.S. companies. Regionally, the largest concentration is in North America (62.8%), followed by Europe (17.2%). Its top 10 holdings are relatively diversified across software, networking, information technology, medical device, waste management and beverage companies.
Fidelity U.S. Low Volatility Equity has its largest concentration in the information technology sector at 21.5%, followed by the health care and financials sectors. The fund holds 130 companies, with approximately 4% concentrated in international equities.
According to Volumetric’s fact sheet, the fund maintains a portfolio containing a blend of value and growth stocks. It may also invest up to 15% of its assets in ETFs. Under positive market conditions, the fund’s total cash and money market positions are typically between 3% and 15%. Total cash and money market positions may increase to 40% under negative market conditions and higher during extremely negative conditions. As of June 30, 2025, the fund held 8.4% of its assets in cash. Of the 56 securities it holds, industrials and financials sector holdings comprise the largest percentage, followed by health care holdings. The SPDR S&P 500 ETF Trust (SPY) was the top equity holding and made up 7.8% of the portfolio.
The fund’s performance has varied widely over time. Since its inception in 1979, calendar-year returns have included a 37.5% gain in 1980 and a 29.96% loss in 2008. Comparatively, the S&P 500 index dropped 37.0% in 2008.
To date, foreign and global large-cap low volatility ETFs have significantly outperformed their U.S. peers, as shown in Table 2. In general, international low volatility ETFs often combine broader sector and geographic exposure, favorable valuations and currency effects, which can help them outperform low volatility ETFs that invest only in U.S. companies.
Download the Excel spreadsheet for Table 2.
The strongest performer year to date as of July 31 is the AB International Low Volatility Equity ETF (ILOW). The actively managed ETF seeks to achieve lower volatility than its benchmarks, targeting an upside capture ratio of approximately 90% and a downside capture ratio of about 70%. This means that if the benchmark index goes up 10%, the ETF is expected to go up roughly 9% on average. If the benchmark index falls 10%, the ETF is expected to drop only 7%. For passively managed funds, upside and downside capture ratios are mostly determined by the rules of the index they track. If the index goes up or down, the ETF moves almost proportionally (after fees). For actively managed ETFs, the actual capture ratios depend on active decisions.
Typically, AB International Low Volatility Equity will hold 70 to 90 securities. Of the ETFs in Table 2, it has the largest exposure to the financials sector, the largest country exposure to the U.K. and the largest currency exposure to the euro. The ETF’s expense ratio of 0.50% is above average (expensive) compared to other foreign large blend ETFs.
The iShares MSCI EAFE Minimum Volatility Factor ETF (EFAV) excludes U.S. and Canadian equities. It is a passively managed fund. Through June 30, 2025, the ETF has achieved a 74% upside capture and a 65% downside capture. Each stock’s volatility in the MSCI ACWI index is measured and correlations are analyzed across sectors and countries. Constraining sector and country weights are applied to stay within ±5% of the benchmark. A portfolio is then optimized under these constraints to form a minimum volatility index, which is rebalanced semiannually. The ETF’s expense ratio of 0.20% is below average (cheap).
A passive international strategy with active security selection is found in the Monarch Volume Factor Global Unconstrained Index ETF (MVFG). It operates similarly to a “fund of funds.” The ETF selects and holds 25 equally weighted international equity ETFs. The fund’s proprietary volume factor ranks market areas with positive cash flow, investing in ETFs tied to sectors and regions with the strongest positive cash flow trends.
When cash flow trends turn negative, it shifts partially or fully into one or more ETFs that hold U.S. Treasurys. Capitulation events are identified using proprietary signals. Year-to-date and one-year returns are below average, and the 1.42% expense ratio is high. The active methodology likely accounts for this “passive” ETF’s atypical expense ratio. This ETF was launched in March 2024 and lacks a long performance record.
Low volatility ETFs often layer other investment factors such as size, momentum and dividend strategy, as shown in Table 2. ETFs can have high tax-cost ratios, lessening tax efficiency. In general, low volatility ETFs that also strive to select high-dividend stocks have higher tax-cost ratios. The Franklin International Low Volatility High Dividend ETF (LVHI) holds non-U.S. stocks, which may incur foreign withholding taxes on dividends. Its tax-cost ratio is one of the highest among the ETFs in Table 2 at 2.52%. Even if foreign taxes are partially recoverable through a foreign tax credit, they still reduce aftertax returns, contributing to a higher tax-cost ratio.
The Invesco S&P 500 Low Volatility ETF (SPLV) was launched in May 2011, making it the “granddaddy” of all low volatility ETFs. It invests in large-cap U.S. stocks from the S&P 500 Low Volatility index. This subset of the S&P 500 selects the 100 companies with the lowest volatility over the past year. Holdings tilt toward the utilities sector, followed by the financials sector.
As of June 30, 2025, average upside and downside capture are 67% and 60%, respectively. Invesco stated that during periods when the CBOE Volatility Index (VIX) spikes, Invesco S&P 500 Low Volatility has outperformed the S&P 500. A recent example is February 19 to April 8, 2025, when the ETF outperformed by 12.4%. This includes the Trump administration announcement of sweeping import tariffs. Year to date as of July 31, 2025, the S&P 500 has gained 8.6%, whereas Invesco S&P 500 Low Volatility has gained 4.7%.
An example of an actively managed low volatility ETF is the First Trust Horizon Managed Volatility Domestic ETF (HUSV). The ETF invests in large-cap U.S. stocks, using historical price data to assess volatility cycles and score individual equities. It selects 50 to 200 stocks with the lowest expected volatility. Larger weights are given to stocks with the most stable outlook, subject to portfolio allocation limits. Year-to-date and one-year returns are above average, with below-average returns over a three-year period. With the second-highest expense ratio (0.70%) in Table 2, active management has not provided a significant edge.
Low volatility is combined with price movement in the First Trust Dorsey Wright Momentum & Low Volatility ETF (DVOL). Securities are first ranked by momentum then assigned a volatility score based on their daily percentage price changes over the trailing year. The 50 securities with the lowest volatility scores are selected for inclusion in the ETF. Adding the additional factor to low volatility does not necessarily improve performance, as evidenced by the ETF’s below-average returns shown in Table 2.
While their mission is to help shield investors from steep drawdowns, this cohort of mutual funds and ETFs still has risks. This is evident in the total risk index, which compares the standard deviation of returns for a given fund with that of all funds in the universe. The average value is 1.00 for all funds, a group that includes both stock and bond funds.
Franklin International Low Volatility High Dividend has the lowest total risk index among funds in both tables at 0.62, The Invesco S&P SmallCap High Dividend Low Volatility ETF (XSHD) has the highest total risk index at 1.72. Most risk indexes are in line with the average.
Some funds are also quite concentrated, with a significant share of assets in the top 10 holdings, leaving concentration risk largely unaddressed.
In addition, defensive low volatility strategies touting stability will perform very differently from low volatility strategies attempting to capture market gains.
When reviewing the maximum upside and downside capture, results for these funds will be different from the S&P 500. For this reason, many low volatility funds realize returns below their category averages during periods of upward-moving stock prices.
Some stocks held in low volatility funds hold up better during down markets, while others are subject to economic cyclicality and geopolitical factors. Low volatility funds can shine during market drawdowns, but performance is subject to index construction and holdings.
Investing in dividend-paying stocks, high-quality fixed-income securities, and mutual funds and ETFs with an equal-weight strategy offer investors the opportunity to lower their portfolio risk with potentially lower costs than low volatility funds.
AAII How-To

ETFs and Mutual Funds

Portfolio Strategies

ROBERT A from NC posted about 1 year ago:
BARRY J from TX posted about 1 year ago:
KEVIN V from NC posted about 1 year ago:
D. R from MD posted 7 months ago:
You need to log in as a registered AAII user before commenting.
Log InCreate an account