

- Comparison of performance based on lump-sum investing versus monthly investing
- The outcome of three withdrawing strategies in retirement over 25 years
- Why diversified portfolios provide resilience compared to single-asset investments under different investment scenarios
The standard method of measuring the performance of exchange-traded funds (ETFs) and mutual funds is to assume that money was invested all at once (a lump-sum investment) and no additional money was invested or withdrawn. Is that how most people invest? I doubt it. Is there a measure of performance that is more realistic? In this article, I present performance results based on two different assumptions: (1) monthly investments and (2) money withdrawn annually.
Imagine asking the following question to 1,000 people: “How are you investing money into your various investment accounts?” Maybe a handful of people respond saying that it was a one-time, lump-sum investment. I’m laboring under the belief that most people invest on a regular basis, probably monthly, into their 401(k)s, 403(b)s or individual retirement accounts (IRAs). I’m also assuming that retirees don’t withdraw money from their portfolios only once.
If you are one of the amazing few that invested money all at once (or only withdrew money one time), hold tight—this analysis may still be of interest to you.
Lump-Sum Investing Returns
Let’s first deal with the standard lump-sum assumption. Figure 1 shows the ending account balance for six core indexes and a diversified 12-asset portfolio on December 31, 2024. The investment began with a $10,000 lump-sum investment made on January 1, 2000. Thus, this is a classic 25-year performance analysis.
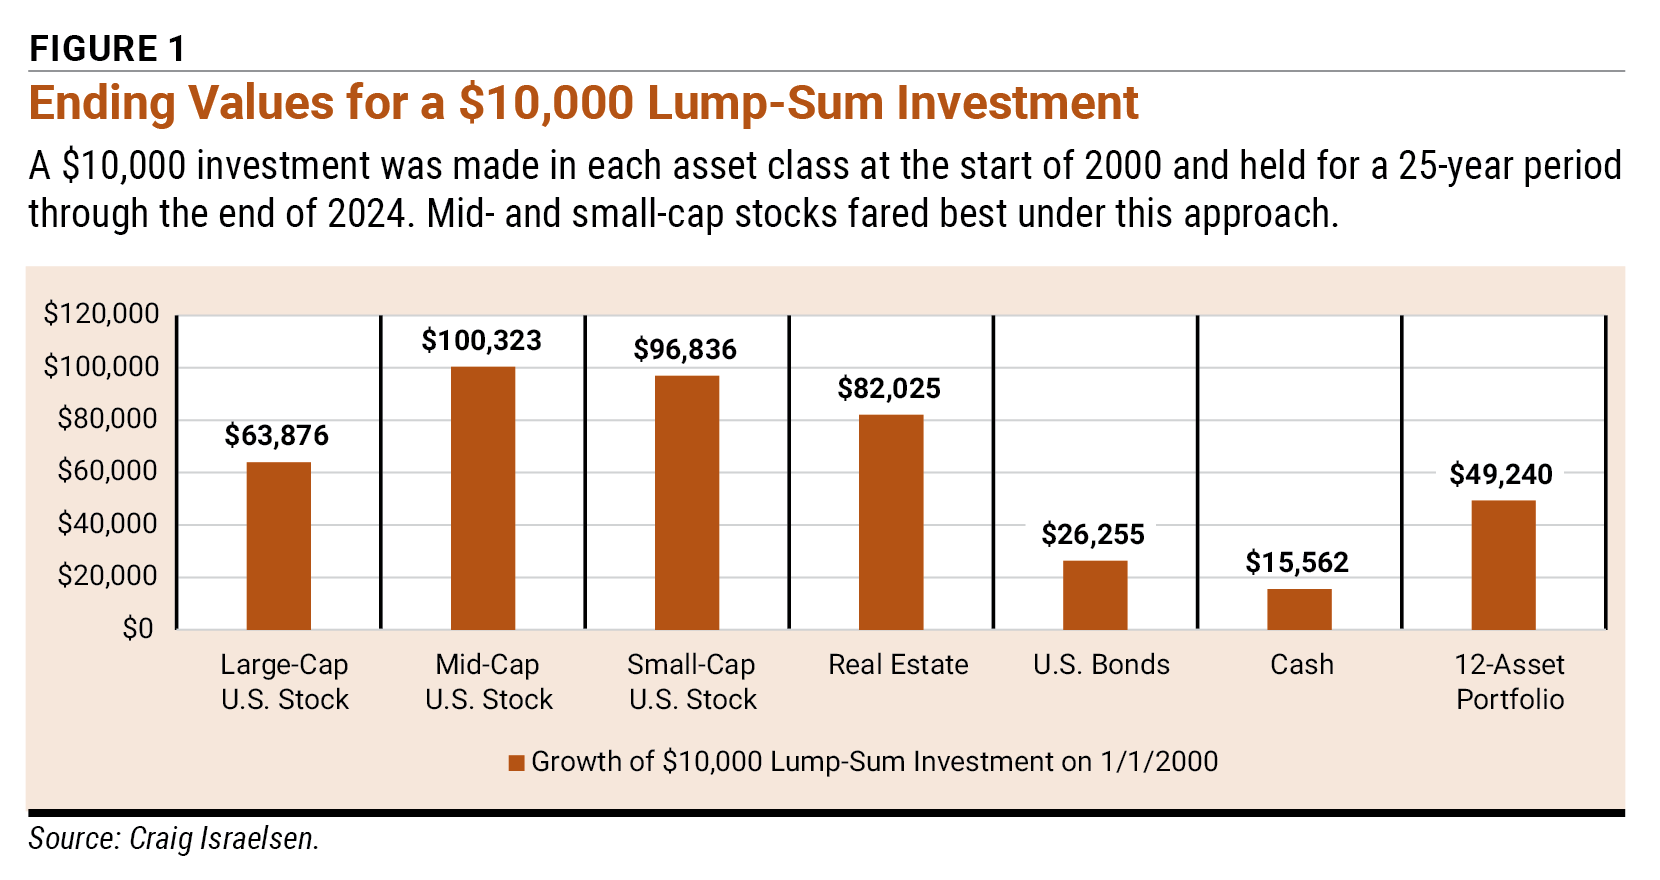
Of these six well-known asset classes, mid-cap U.S. stock was the clear winner over the past quarter century, followed closely by small-cap U.S. stock. Real estate had the third-highest ending value, with large-cap U.S. stock (represented by the S&P 500 index) in a distant fourth. U.S. bonds and cash (represented by 90-day Treasury bills) were far behind.
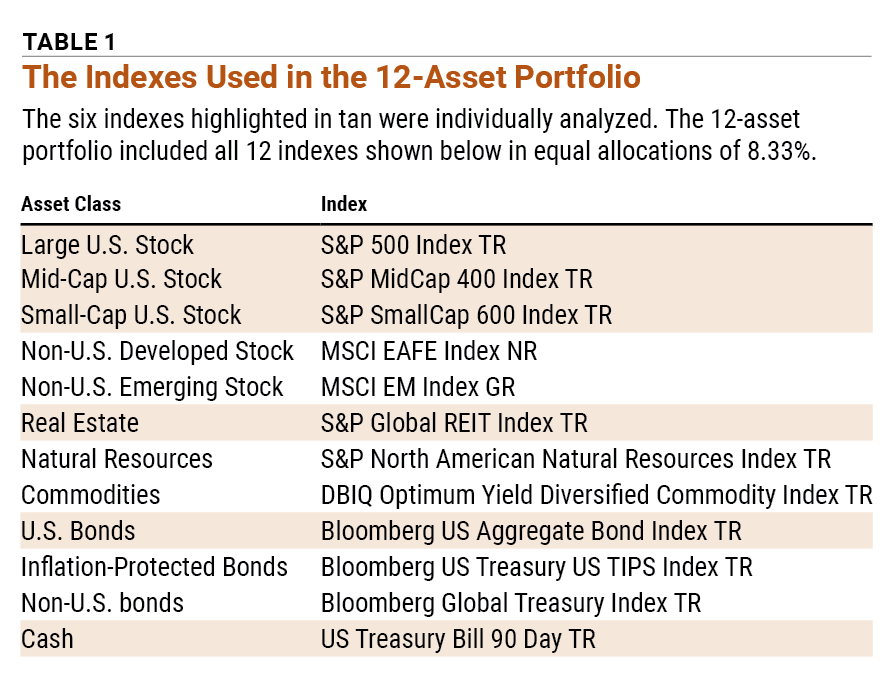
The performance for the 12-asset portfolio shown in Figure 1 is based on investing in 12 prominent indexes in equal allocations of 8.33%. The actual indexes are shown in Table 1 below. The 12-asset portfolio represents a diversified approach to investing that is vitally important—particularly during the retirement years.
Returns Based on Monthly Investments
Let’s now change the assumption to a monthly investment of $33.33. This amount was calculated by dividing $10,000 by 300 months—as there are 300 months in a 25-year period. In other words, $33.33 invested monthly for 25 years equals the amount of the lump-sum assumption in terms of total dollars invested.
Figure 2 shows the results. When we change the assumption to monthly investing, the winner among these six indexes over the past 25 years is large-cap U.S. stock (the blue bar) with an ending balance of $49,337. The actual sequence of annual returns—in this case, 25 annual returns for each index—makes no difference when we assume a lump-sum investment. However, the sequence of returns makes a considerable difference when we assume a monthly investment (or any systematic, repeated investment).
Systematic investing (in this analysis, monthly) is advantaged when the returns of the asset (in this case, indexes) are better during the latter years of the period being measured. This is because those “better” returns are “working” on a larger balance than during the early years.
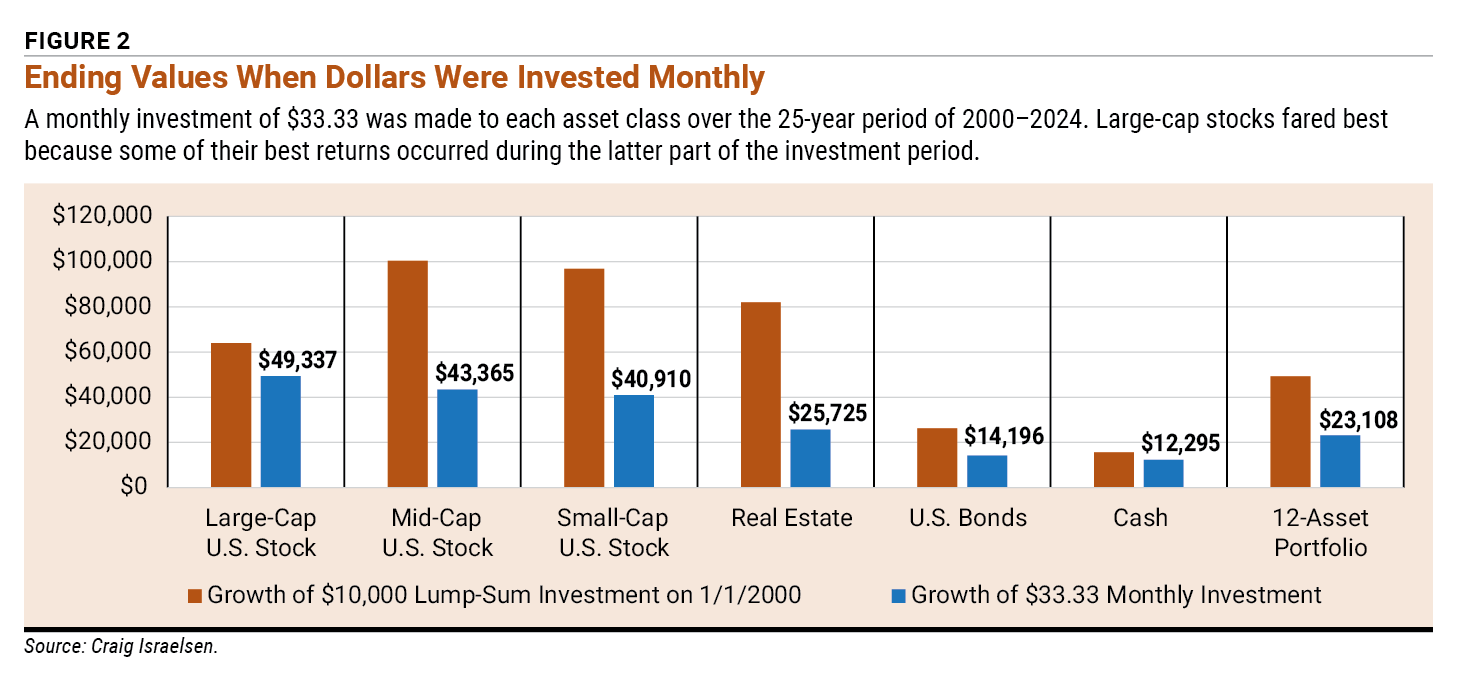
Case in point: Over the most recent three calendar years (2022, 2023 and 2024), large-cap U.S. stock had an annualized return of 8.9%. In contrast, mid-cap U.S. stock returned 4.9%, while small-cap U.S. stock returned 1.9%. The better returns of large-cap U.S. stock (compared to mid- and small-cap U.S. stock) during the last three years show up clearly in the ending account values in Figure 2.
So, which index performed better over the past 25 years—large- or mid-cap U.S. stock? It depends on how the money was invested. If a lump-sum investment is assumed, mid- and small-cap U.S. stock were the clear winners. If a monthly investment was assumed, large-cap U.S. stock did best—but the margin of victory was not nearly as decisive as it was for a lump-sum investment.
Returns Based on Types of Portfolio Withdrawals
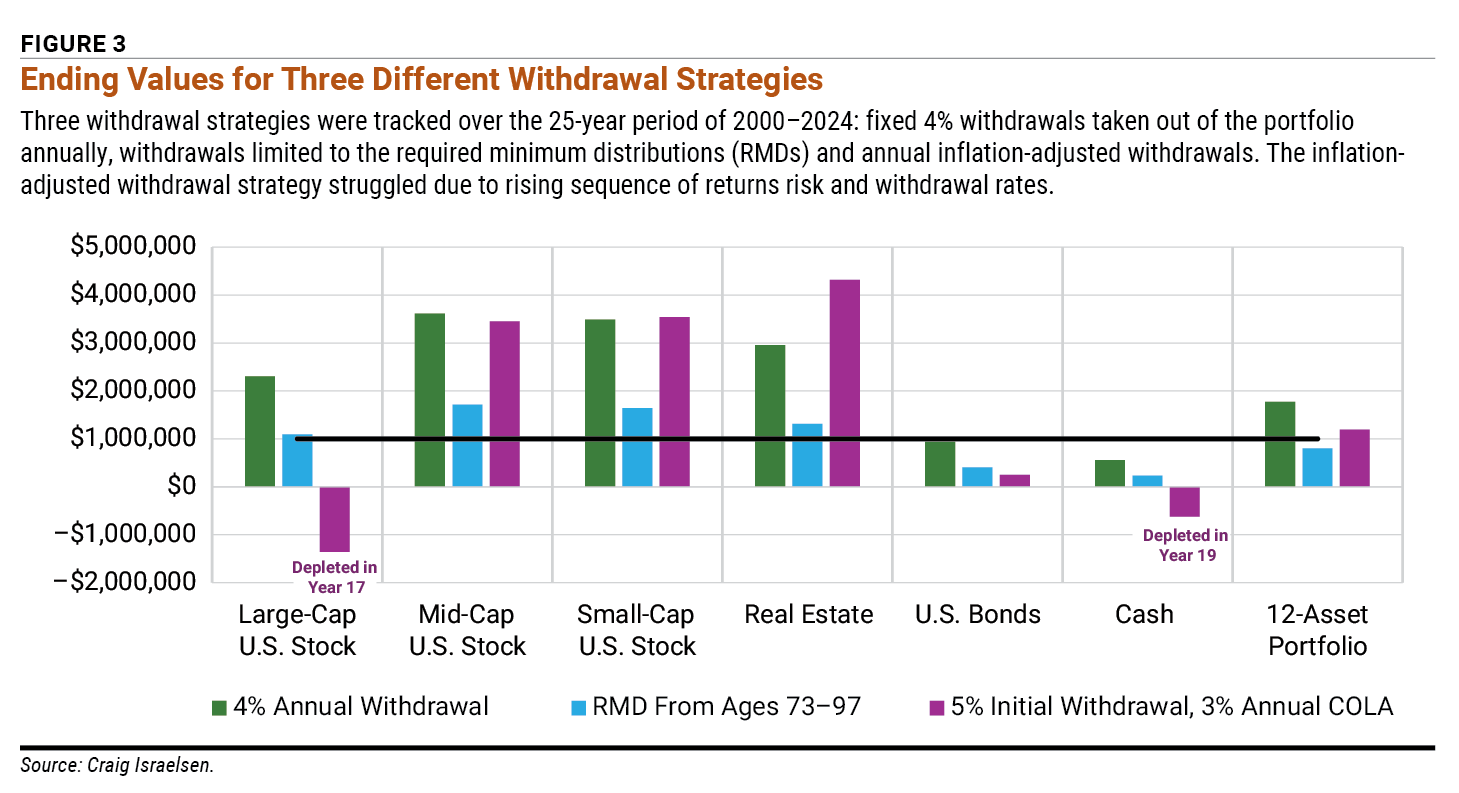
We now pivot to a comparison of how well these various indexes performed when money was being withdrawn, as in a retirement account. Figure 3 presents the ending values of a $1 million retirement account after 25 year-end withdrawals.
Three different types of annual withdrawals were analyzed. The green bars in Figure 3 represent the ending account value after 25 years if 4% of the year-end account balance was withdrawn annually. The blue bars indicate the ending balance in year 25 if the withdrawal percentage was determined by the required minimum distribution (RMD) from ages 73–97. Finally, the purple bars indicate the ending balance in a retirement portfolio if the first withdrawal in year one was 5% of the portfolio’s starting balance—or $50,000 in this analysis based on a starting balance of $1 million—followed by a 3% cost-of-living adjustment (COLA) in the dollar amount withdrawn in years two through 25. This scenario represents a mandated COLA each year.
Fixed 4% Withdrawals
The black line represents the starting balance of $1 million in the retirement portfolio. If 4% of the portfolio’s year-end balance was withdrawn at the end of each year, the winners were mid- and small-cap U.S. stock with ending balances of roughly $3.5 million. Real estate wasn’t far behind with an ending balance of just under $3 million. Large-cap U.S. stock finished with $2.3 million. U.S. bonds finished just below the starting account value ($946,232). A retirement portfolio consisting entirely of cash survived all 25 years (assuming 4% annual withdrawals) but was drawn down to $560,849. The 12-asset portfolio finished with close to $1.8 million. The 12-asset portfolio has roughly a 65% equity/35% fixed-income allocation.
RMD-Based Withdrawals and Portfolio Returns
If we assume the annual withdrawals were RMD-based, all six asset classes survived intact for the full 25 years of withdrawals. However, the ending balances were far lower than if 4% was withdrawn annually. Still, none of the individual asset classes ran out of money even after 25 years of withdrawals, which is a very encouraging aspect of a reasonable, percentage-based withdrawal system.
Inflation-Adjusted Withdrawals and Portfolio Returns
When we assume a 5% initial withdrawal with a 3% annual COLA thereafter, the results are catastrophic for large-cap U.S. stock. A retirement account entirely invested in the S&P 500 ran out of money in year 17. By comparison, the mid- and small-cap indexes had balances of approximately $3.5 million in year 25. The real estate index fared best with an ending balance of over $4.3 million. A 100% bond retirement portfolio was barely solvent after 25 years, with an ending balance of $246,151. The retiree that invested their $1 million into nothing but “cash” (90-day Treasury bills) ran out of money by year 19.
Major Factors in the Return Differences
The prudent retiree who built a broadly diversified portfolio consisting of 12 asset classes (12 indexes) had an ending balance of nearly $1.2 million—$200,000 more than they started with. And that’s after 25 years of withdrawals that totaled more than $1.8 million!
What in the world happened to large-cap U.S. stock in this retirement portfolio scenario? The S&P 500 performed decently in the lump-sum investment scenario, was the star in the monthly investing scenario and did reasonably well with a 4% annual withdrawal or an RMD-based withdrawal. When we assumed a first-year 5% withdrawal and then “hard-dollar” 3% COLAs each year thereafter, the wheels completely came off. An all-cash retirement performed better than large-cap U.S. stock.
There are two major factors that created the perfect storm for the S&P 500 during this particular 25-year period from 2000–2024: sequence of returns risk and cash-based escalating withdrawals.
First, the sequence of returns issue. As already noted, the S&P 500 had stellar returns during the last three years of the period (2022, 2023 and 2024), which gave it the advantage in the monthly investing scenario. However, the first three years of this 25-year window were horrible for large-cap U.S. stock. In 2000, the S&P 500 had a return of –9.1%. In 2001, its return was –11.9%. In 2002, the S&P 500’s return was –22.1%. When money is being withdrawn, the worst possible situation is to have large losses in the early years. That’s exactly what happened to the S&P 500—and the result is painfully obvious in Figure 3.
Mid- and small-cap U.S. stock did not suffer the same losses in 2000–2002. In fact, when the S&P 500 lost 9.1% in the year 2000, the S&P MidCap 400 index gained 17.5% and the S&P SmallCap 600 index gained 11.8%. In 2001, when large-cap U.S. stock lost nearly 12%, mid-cap stock lost only 0.61% and small-cap stock gained 6.54%.
The second issue that doomed large-cap stock was a cash-based, escalating withdrawal system. This method is ruthless because, unlike a percentage-based withdrawal method, the withdrawals are blind to the performance of the portfolio. Even after a year like 2008 when nearly every asset class lost money, a forced COLA withdrawal system demands a larger withdrawal than in the prior year. This can be a portfolio killer.
A percentage-based system (such as the famous 4% rule or the RMD schedule) allows the withdrawal after a bad year like 2008 to be smaller because the portfolio balance has gone down. This allows a retirement portfolio to heal, at the “cost” that the retiree will experience some years where the portfolio withdrawal is somewhat smaller. This is where other sources of retirement income and tighter control of spending become important.
The Right Way to Measure Investment Performance?
After considering all this information, what is the right way to measure investment performance? Well, there is no single correct method. The industry-published figures will always assume a lump-sum investment. The most logical measure of performance should be sensitive to how you actually invest.
For those who are math-phobic, there is another eminently logical measure of performance: Are you on track to meet your investing goals? If so, you’re good to go.

Related

Related

Discussion
FREE REPORT

Get your free copy of our special
report analyzing the tech stocks
most likely to outperform the
market.
BARRY J from TX posted about 1 year ago:
ROBERT A from NC posted about 1 year ago:
Robert B from OH posted about 1 year ago:
Craig I from UT posted about 1 year ago:
J M from NJ posted about 1 year ago:
HARRY R from OH posted 10 months ago:
You need to log in as a registered AAII user before commenting.
Log InCreate an account