


Related

AAII + BetterInvesting
AAII’s surveys historically reach extremes just before major market turning points, while BetterInvesting’s tools reveal what investment clubs are buying and the analytical thoughts of seasoned individual investors.
Wayne Thorp leads a class in AAII's new Essential Investing Video Course. Go to https://www.aaii.com/ves for more information and to subscribe.
Being able to judge market sentiment and incorporate collective wisdom can help make you a better investor.
Throughout history, market bubbles have formed as the fear of missing out (FOMO) prompts investors to keep buying regardless of valuations or other fundamentals. Severe downturns have been marked by widespread selling, as many investors focus on the downside instead of the bargain prices on many stocks.
Investors cognizant of their behavioral biases often look to the wisdom of the crowds to uncover blind spots. This can be a check against their own analysis or a way to find potential investment ideas they may otherwise miss.
AAII and BetterInvesting (BI) believe that individual investors can benefit from combining AAII’s Investor Sentiment and Asset Allocation Surveys with BetterInvesting’s community-driven tools. AAII’s surveys historically reach extreme highs and lows just before major market turning points. BetterInvesting’s tools reveal what investment clubs are buying and the analytical thoughts of seasoned individual investors.
Investor sentiment describes the collective emotions, opinions and attitudes of market participants at a specific point in time—essentially serving as the market’s psychological barometer. While sentiment cannot predict future movements, it reveals critical insights into current investor psychology that drive short-term prices as much as, if not more than, fundamental business performance.
The core principle underlying sentiment analysis rests on a mathematical and psychological reality: Markets consistently move against the majority, particularly when consensus reaches extreme levels. This contrarian dynamic occurs due to simple supply and demand mechanics combined with human psychology.
Bullish sentiment typically reaches extremes following strong market advances during which investors have become fully invested, often borrowing additional capital while encouraging others to join the rally. The critical problem emerges when everyone who wants to buy has already done so. Who remains to push prices higher?
The opposite scenario proves even more powerful for creating investing opportunities. Bearish sentiment reaches extremes after investors have already sold positions, moving into cash, bonds or other defensive assets. The selling pressure driving markets lower has exhausted itself. Unlike bulls who have depleted purchasing power, bears sitting in cash possess tremendous buying capacity, requiring only a compelling reason to deploy reserves.
The AAII Investor Sentiment Survey, launched in July 1987, represents one of the longest-running measures of individual investor psychology. The survey methodology emphasizes simplicity: Each week, AAII members answer a single question about their six-month market outlook, choosing from bullish, bearish and neutral responses.
This six-month time frame proves crucial; it is long enough to filter out daily market noise while remaining short enough to capture actionable viewpoints. Only AAII members can participate, with one vote per person per week, ensuring data integrity.
Analysis of nearly 2,000 weekly observations reveals instructive patterns. Bullish sentiment averages 37.6%, reflecting the market’s long-term upward trajectory. However, extremes provide the most valuable insights. Peak bullishness of 75.0% occurred in January 2000, just months before the dot-com crash. The survey’s lowest bullish reading of 12.0% came in November 1990, when Gulf War uncertainty, recession concerns and the savings and loan crisis crushed confidence. Yet, this extreme pessimism marked an exceptional entry point, with markets gaining 21% over the subsequent year.
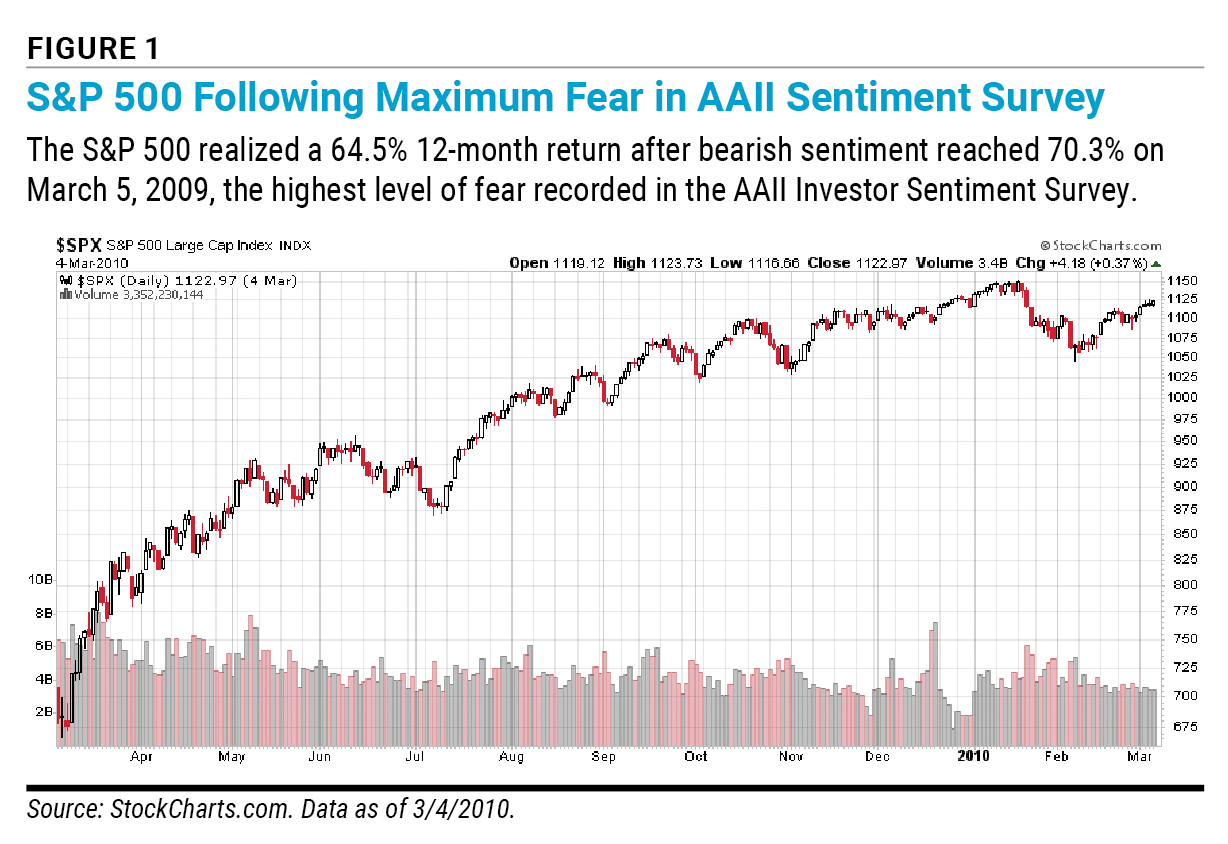
Bearish sentiment extremes tell equally compelling stories. The highest bearish reading in the history of the AAII Investor Sentiment Survey of 70.3% occurred in March 2009, within days of the generational market bottom during the Great Recession. Despite major banks teetering on the brink of collapse and unemployment soaring, those who acted on extreme pessimism were rewarded with nearly 65% gains over the following year (Figure 1).
Statistical analysis reveals the power of extreme readings. Bullish sentiment reaching three or more standard deviations above average has occurred only five times in 1,979 observations—just 0.25% of all readings. Following such extreme optimism, average one-year returns measured merely 0.6%, compared to the market’s typical 10.0% annual average. When bullishness fell two standard deviations below average, subsequent returns averaged 18.1%. The asymmetry is clear: Fear creates more opportunity than greed creates risk.
AAII’s proprietary sentiment data has been combined with nine additional indicators to create a comprehensive market psychology mosaic called AAII Sentiment Investing. The platform tracks short interest for crowded trades, yield curves for recession signals, Advance/Decline ratios (ADRs) for market breadth and the CBOE Volatility Index (VIX) for options-implied volatility. It also monitors market momentum through S&P 500 index moving averages and valuation using Shiller’s cyclically adjusted price-earnings (CAPE) ratio.
The platform provides both current readings and historical context. A reading might seem extreme today but normal by historical standards. The goal isn’t perfect market timing, but rather identifying when probabilities shift in investors’ favor.
AAII’s monthly Asset Allocation Survey, dating back to November 1987, tracks what individual investors actually do with their money. Historical data shows average member allocations of 62% stocks and stock funds, 16% bonds and bond funds, and 22% cash. These allocations fluctuate with market conditions, providing another contrarian indicator.
Statistical analysis reveals uncomfortable truths about investor behavior. Individual investors consistently buy high and sell low, with stock allocations showing a positive 49% correlation with market performance. After market drops exceeding 5%, investors reduce stock allocations by 0.33% the following month. After rallies above 5%, they increase stock allocations by 1.02%. They’re literally doing the opposite of buying low and selling high.
Fear periods last twice as long as greed periods, averaging 11 months versus five, compounding the behavioral damage. At every market bottom—such as March 2009 and March 2020—individual investors held minimum stock allocations, panic-selling precisely when they should have been buying.
Sentiment data reveals when emotions are driving markets, but knowing about these behavioral biases isn’t enough. You need a plan.
Think about March 2009 when the Great Recession bottomed. Those without a plan were making decisions based on emotion, specifically fear and waiting for things to feel better. Those with a plan acted mechanically, standing pat while the rest of the world was panic-selling.
Your plan should outline when to act and when not to act. The specifics matter less than having them written down before emotions cloud your judgment. Remember, sentiment data is a tool, not a crystal ball. It works best when combined with other indicators, such as valuation and technical and fundamental analysis.
We think you’d like this related webinar!
AAII + BetterInvesting: Smarter Sentiment Strategies
BetterInvesting’s community-driven tools harness the collective intelligence of thousands of active investors and investment clubs, revealing what they are doing.
Understanding what drives collective investing behavior provides crucial context for individual decision-making. When large numbers of experienced investors gravitate toward specific companies or sectors, it signals either emerging opportunities or potential overcrowding. The key lies in interpreting these signals within the broader market context and using them as starting points for independent analysis rather than blindly following the crowd.
BetterInvesting’s Most Active Stocks list represents one of the most valuable community intelligence tools available to individual investors. This data reflects actual buy and sell transactions by investment club members over the preceding eight weeks. The accuracy stems from real money at stake—clubs must report actual transactions, not intentions or opinions.
The list typically features mega-cap and large-cap companies commanding broad investor attention. However, the real value lies in understanding why certain stocks experience buying or selling pressure within an educated, long-term-oriented investor community. When sophisticated investment clubs—some with decades of experience—begin accumulating or disposing of positions, it often signals fundamental changes worth investigating.
The behavioral patterns revealed through active trading data provide insights into community risk tolerance and opportunity recognition. When defensive stocks gain favor, it suggests broader market concerns. When growth names dominate, it indicates renewed optimism. These shifts often precede broader market movements, giving observant investors early warning signals.
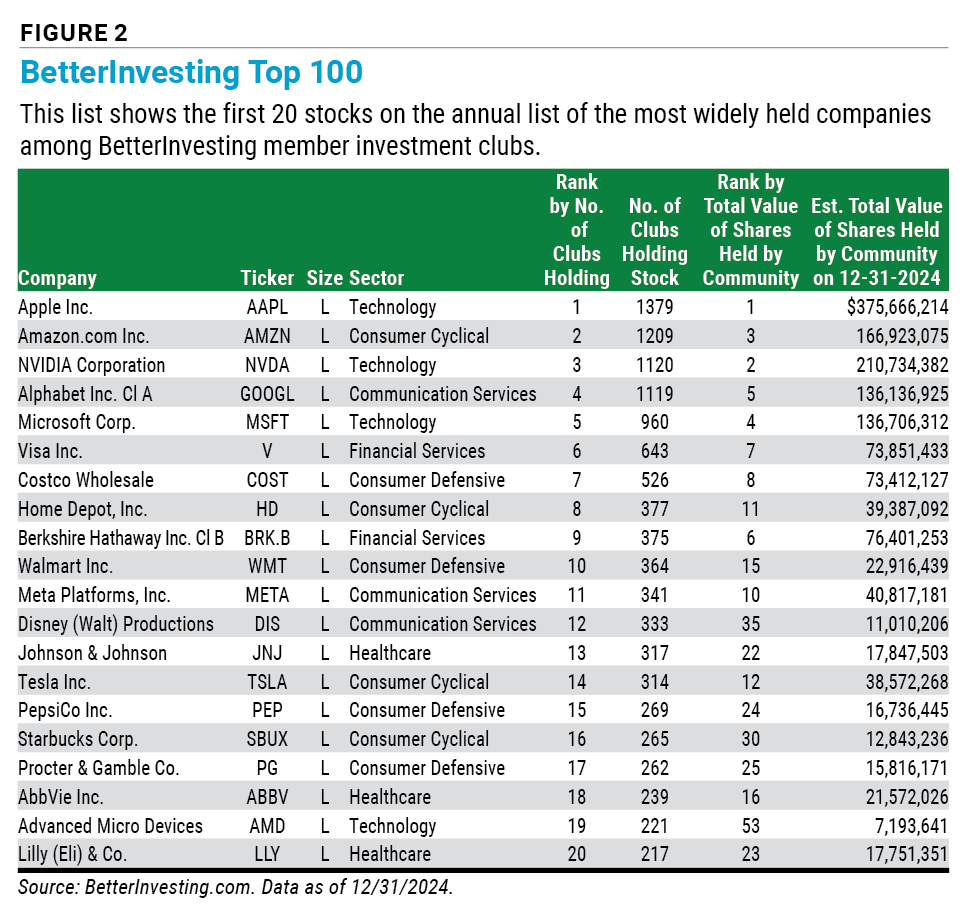
The annual BetterInvesting Top 100 compilation, published each April based on prior-year holdings, reveals the most widely held companies among member investment clubs (Figure 2). This data offers unique insights into long-term portfolio construction patterns among experienced individual investors who have weathered multiple market cycles.
For the full list of 100 stocks, click here.
The list predictably features familiar mega-cap names—Apple Inc.  (AAPL), Amazon.com Inc. (AMZN), Nvidia Corp. (NVDA), Alphabet Inc. (GOOGL) and Microsoft Corp. (MSFT)—reflecting both performance and liquidity considerations. However, deeper analysis reveals more intriguing patterns. Many holdings represent contrarian or defensive positions accumulated over decades by clubs with 40–50-year track records. These established portfolios demonstrate commitment to long-term holding periods that transcend temporary market fluctuations.
The BetterInvesting 100 index, an equal-weighted compilation rebalanced annually, provides performance benchmarking for community-driven stock selection. Its performance relative to major indexes reveals whether collective individual investor decision-making adds value over passive indexing approaches. Historical analysis shows that the BetterInvesting 100 typically performs close to the S&P 500 Equal Weight index, suggesting that individual investor collective wisdom matches professional portfolio construction.
More importantly, examining year-over-year changes in top holdings reveals evolving community sentiment and strategic adjustments. New additions often represent early recognition of emerging opportunities, while departures may signal concerns about fundamental deterioration or valuation extremes.
BetterInvesting’s community-driven research tools transform individual analysis into collective intelligence. The First Cut Stock Reports feature multipage research analyses created by volunteer members using standardized templates. These reports detail decision-making processes for growth rate selections, price-earnings (P/E) ratio assumptions and other judgment-based inputs.
Comparing personal analytical conclusions with community research can reveal blind spots, confirm assumptions and/or challenge preconceived notions. When multiple experienced analysts reach similar conclusions using different analytical paths, it strengthens conviction. When analyses diverge significantly, it prompts deeper investigation into differing assumptions.
The Ticker Heat Map provides real-time visualization of community research activity, displaying the most studied companies by BetterInvesting members over rolling 90-day periods. This tool reveals where collective attention is focused and whether intensive research translates into positive or negative assessments.
The Member Sentiment feature within BetterInvesting’s Stock Selection Guide (SSG) Plus platform aggregates individual analytical judgments across key projection categories: projected sales and earnings growth rates, expected price-earnings ranges, earnings forecasts, dividend payout assumptions and bottom-line total return expectations. This aggregated data provides powerful second opinions for individual analysis while revealing community consensus around specific companies.
When 200+ studies contribute to consensus projections after outlier removal, the aggregated wisdom carries significant weight for validating or challenging individual assumptions. Wide analytical ranges suggest uncertainty or disagreement about company prospects, while tight consensus indicates broad agreement about outlook.
Perhaps most valuable, BetterInvesting’s Member Sentiment tool reveals when community assessments diverge from market pricing. Experienced analysts projecting 22% annual returns for companies trading at current prices suggests either market mispricing or analytical overoptimism.
The key to leveraging community intelligence lies in treating collective behavior as information rather than instruction. When investment clubs accumulate positions during negative news cycles, it provides research starting points rather than buy signals. When community research heavily favors specific companies, it suggests either consensus opportunities or potential overcrowding requiring careful evaluation.
Community notes and research-sharing provide additional layers of analytical validation. The collaborative approach helps individual investors avoid echo chambers while benefiting from diverse analytical approaches and specialized industry knowledge.
Most importantly, community intelligence works best when combined with independent analysis and clear investment criteria. The goal isn’t to follow the crowd but to understand crowd behavior well enough to identify opportunities others miss or confirm analytical conclusions through collective validation. By observing what experienced long-term investors actually do with their money—rather than what they say—individual investors gain valuable insights into practical portfolio management and opportunity recognition during various market conditions.
Sentiment helps you identify when the emotions have swung too far toward greed or fear. Investment club portfolio changes can show you where to look for potentially rewarding investments that can help you profit from the market’s next regime.
AAII members can join BetterInvesting for just $99 for the first year (regularly $145). Click here and use the promo code AAII. New BetterInvesting membership includes: the BetterInvesting Magazine, full access to the SSGPlus online tools suite, First Cut stock studies and a learning library.
AAII + BetterInvesting

AI-Powered Investing

Portfolio Strategies

JOHN L from NJ posted about 1 year ago:
CHARLES R from IL posted about 1 year ago:
BARRY J from TX posted about 1 year ago:
ROBERT A from NC posted about 1 year ago:
BARRY J from TX posted about 1 year ago:
JOHN L from NJ posted about 1 year ago:
BARRY J from TX posted 12 months ago:
CHARLES R from IL posted 12 months ago:
JOHN L from NJ posted 12 months ago:
JAMES G from FL posted 12 months ago:
ROBERT A from NC posted 11 months ago:
JOHN M from PA posted 11 months ago:
BARRY J from TX posted 11 months ago:
You need to log in as a registered AAII user before commenting.
Log InCreate an account