

- How AI tools help investors process economic data, detect patterns and summarize reports for faster macroeconomic understanding
- What AI can and can’t do in economic analysis, including its strengths and limitations and best practices for accuracy
- Practical ways to integrate AI into investing routines to improve insight, efficiency and decision-making discipline
Today’s investors face a deluge of economic information—employment reports, inflation updates, consumer sentiment releases and central bank statements. Each week brings data that can move markets, influence asset valuations and shift investor psychology. Yet interpreting this information has traditionally required hours of research and a professional’s command of macroeconomics.
Artificial intelligence (AI) is changing that. AI tools can summarize complex reports, detect hidden patterns in data and visualize trends that would otherwise go unnoticed. These tools can help individual investors turn information overload into actionable insight and gain understanding of the macroeconomic elements driving market actions.
Of course, AI is not a magic crystal ball. It is best utilized as a research assistant—one that’s only as good as the data it’s trained on and the questions you ask (prompts). Used thoughtfully, AI can streamline economic analysis, highlighting turning points that can complement traditional stock screening and analysis and portfolio management. Used blindly, it can mislead as easily as it can inform.
The opportunity lies in balance: leveraging AI’s analytical power without losing the discipline and judgment that make individual investors successful over the long term.
What AI Can—and Can’t—Do in Economic Analysis
AI excels at pattern recognition, summarization and correlation discovery. For economic analysis, this means processing thousands of data points—from gross domestic product (GDP) growth and unemployment figures to manufacturing indexes and consumer prices—to find relationships or shifts faster than any human could.
Machine learning (ML) algorithms can identify nonlinear relationships between variables. For example, an AI model might detect that inflationary pressures rise when both wage growth and capacity utilization exceed certain thresholds. Natural language processing (NLP), another branch of AI, can analyze text—like Federal Reserve statements, financial news or social media—to assess whether tone is hawkish, dovish or neutral.
However, AI’s strengths come with critical caveats:
- AI doesn’t understand causation. It identifies statistical associations, not the underlying “why.”
- Models are only as good as their data. Economic data can be revised, misreported or skewed by one-time events.
- Black box outputs can mislead. Many proprietary systems don’t explain how they reach conclusions, leaving users unable to verify results.
For individual investors, the takeaway is clear: Treat AI as a supplement to, not a substitute for, human reasoning. A well-crafted prompt—such as, Summarize key themes from the latest FOMC statement and their implications for rates—can save time and reveal insights. But the interpretation still requires your experience and skepticism.
Four Ways AI Can Strengthen Your Economic Insight
1. Spotting Emerging Economic Trends
AI can rapidly analyze vast historical and real-time datasets, turning thousands of numbers into concise insights. Investors can directly query a general AI assistant such as Claude to search for published economic reports and present a summary analysis with links for further reading.
The technically savvy investor may turn to AI-powered analytics platforms like FRED AI Visualizer’s Series Explorer to directly examine decades of GDP, inflation and employment data to find inflection points or anomalies.
Let’s say you want to know whether inflation pressures are building again. You could upload recent consumer price index (CPI), wage growth and commodity price data into a simple AI model—built using ChatGPT’s Code Interpreter, for example—to visualize when inflation momentum last accelerated under similar conditions. Instead of manually plotting charts or calculating rolling correlations, AI handles the data work, freeing you to focus on implications.
Individual investors can also use AI-driven dashboards that integrate multiple indicators. For example, combining The Conference Board Leading Economic Index (LEI) with housing and sentiment data can reveal subtle turning points. These insights can guide tactical decisions—such as whether to favor cyclical or defensive stocks, or whether to favor longer- or shorter-maturity bonds.
The key is repeatability. Create a structured workflow: Update your indicators monthly, feed them into AI summarization tools and note when composite signals change direction. Over time, patterns emerge that mirror those seen in professional macroeconomic research.
2. Analyzing Economic Sentiment
Market psychology is often as powerful as the data itself. NLP models enable investors to quantify that psychology in new ways. Tools like FinBERT, Google Cloud Natural Language API and MarketPsych can evaluate the sentiment of thousands of financial news articles or central bank communications. By classifying text as positive, neutral or negative toward key economic themes—growth, inflation, employment, policy, etc.—these systems can produce sentiment scores.
For example, during a tightening cycle, investors can analyze the language of Federal Open Market Committee (FOMC) statements. An AI model might detect that the word “uncertainty” appears more frequently while “resilient” declines—signs that policymakers are softening their tone even before they officially cut rates. Similarly, tracking sentiment in consumer confidence surveys or corporate earnings calls can reveal whether optimism is fading beneath surface-level numbers.
You don’t need to be a programmer to experiment with a system such as FinBERT. The easiest way to do so is through its free demo on the Hugging Face website. Simply paste in text from a Fed statement, earnings report or economic news story, and FinBERT instantly rates the passage as positive, negative or neutral.
More ambitious investors can run prebuilt notebooks in Google Colab, which allows you to upload multiple documents and track sentiment over time without installing any software. Users can move from reading headlines to quantifying tone—turning qualitative commentary into a measurable indicator.
AAII members familiar with contrarian indicators will recognize the advantage here. Extreme pessimism or optimism in economic commentary often marks transition zones. AI doesn’t just save time reading—it helps quantify emotional extremes that human investors can consider.
Practical workflow: Use ChatGPT or Claude to summarize five major economic headlines daily, classify tone and record a rolling average to see whether mood shifts align or diverge.
3. Forecasting and Scenario Modeling
Perhaps AI’s most ambitious use in economics is forecasting. ML models can ingest dozens of variables—employment, housing starts, bond spreads, retail sales, etc.—and estimate future GDP or inflation trends.
For individual investors, forecasting doesn’t require deep coding expertise. Platforms like Google Colab or Microsoft Copilot in Excel can run regression, Autoregressive Integrated Moving Average (ARIMA) or random forecast models with minimal setup.
For example, suppose you want to test whether falling job openings predict lower inflation within two quarters. You can download a historical series from the FRED database, instruct ChatGPT to train a regression model and visualize the lag relationship. The result won’t guarantee a relationship, but it will illuminate whether the data historically supports your intuition.
Scenario modeling is another useful angle. AI can simulate “what if” outcomes: What if the Fed cuts interest rates by 50 basis points? What if wage growth accelerates but energy prices fall? These models can help investors stress-test portfolio assumptions, such as the sensitivity of dividend-paying stocks or small caps to shifting macroeconomic conditions.
Caution is warranted. AI models extrapolate from the past, and structural breaks—like the coronavirus pandemic or a change in fiscal policy regime—can render old relationships unreliable. The most valuable use of AI forecasting isn’t in prediction precision but in hypothesis testing: If these conditions hold, what has typically followed?
4. Summarizing and Visualizing Economic Data
Perhaps the most accessible AI advantage for individual investors is the ability to automate data presentation.
Visualization tools powered by AI—such as Tableau AI, Microsoft Copilot for Power BI or ChatGPT’s Advanced Data Analysis mode—can turn raw time series into charts, heat maps or correlations instantly. Simply upload your CSV file of unemployment rates, CPI and GDP, and prompt the AI to plot all three with recession periods shaded and label turning points. What once took hours in Excel can appear in seconds.
Beyond graphics, summarization is equally powerful. AI can read the U.S. Bureau of Labor Statistics’ (BLS) 30-page Employment Situation report and condense it into a four-sentence brief highlighting the change in payrolls, the unemployment rate and average hourly earnings. You can even ask the AI to: Explain how this month’s data compares to the six-month trend and what that implies for rate policy.
For data-driven investors who prefer narrative context, these tools bridge the gap between numbers and meaning. Pair them with regular economic commentary to verify whether AI-generated summaries align with established expert analysis.
Practical Tools for Individual Investors
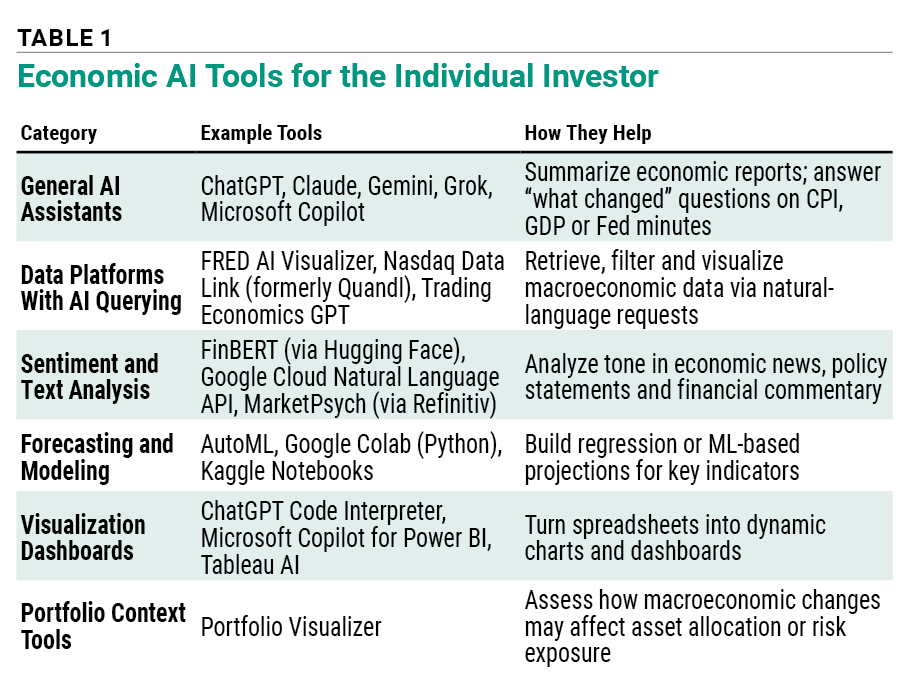
There’s now a growing ecosystem of AI tools that blend usability with analytical depth. Table 1 provides a sample of accessible options for individual investors. Many of these tools offer free versions or trial tiers, making it easy for investors to experiment.
A suggested progression for investors:
- Start with ChatGPT or Microsoft Copilot for summarization of economic data.
- Add FRED or Nasdaq Data Link for data access and charts.
- Experiment with Tableau AI for visual dashboards.
- Finally, test small forecasting projects using Google Colab or Kaggle Notebooks.
For most investors, simply using general AI assistants such as ChatGPT to summarize economic data is sufficient; however, if you wish to explore and layer these tools, you can create an analysis system that blends macroeconomic awareness with portfolio context.
Integrating AI Into Your Investing Routine
The true power of AI emerges through consistent use, not one-off experiments. The best investors develop routines—structured habits that keep data, context and judgment in sync. Here’s one possible framework.
- Weekly (15–30 minutes): Use ChatGPT or Microsoft Copilot to summarize key economic releases (CPI, jobless claims, retail sales). Example prompt: What changed vs. consensus, and what direction does it suggest for the next Fed meeting? Track tone and direction rather than raw numbers.
- Monthly (60 minutes): Update your AI dashboard of leading indicators—ISM manufacturing index, housing starts, yield curve, sentiment. Have AI flag metrics that are improving or deteriorating. Example prompt: Summarize whether the latest U.S. leading indicators point toward acceleration or deceleration.
- Quarterly (90 minutes): Use ML-based regression or scenario tools to stress-test portfolio exposures. Example prompt: If the 10-year Treasury yield falls 50 basis points, which type of holdings historically benefit most?
This routine aligns with AAII’s educational philosophy: empowering investors to make evidence-based, repeatable decisions.
The key is to keep it simple and consistent. AI enhances pattern recognition, but discipline sustains performance.
Five AI Prompts for Smarter Economic Analysis
- FOMC Insight: Summarize the main themes in the latest FOMC statement and how they relate to future interest rate policy.
- Leading Indicators: List three leading and three lagging indicators currently signaling a shift in U.S. economic momentum.
- Sector Implications: Explain how a 25-basis-point rate cut could affect financials, utilities, and technology stocks.
- Historical Perspective: Compare current inflation and unemployment trends to 2006–2007 and 2019–2020 periods.
- Visualization Task: Create a chart of U.S. GDP growth, CPI inflation, and unemployment from 2010–2025 with recession periods shaded.
Try one of these before your next portfolio review. You may discover that AI doesn’t just summarize data, it reshapes how you understand the economy itself.
Cautions, Biases and Verification
AI’s analytical reach is extraordinary—but it carries risks that thoughtful investors must manage.
Correlation Does Not Equal Causation
AI identifies patterns, not logic. A model may find that rising search volume for “recession” predicts lower GDP—but that doesn’t mean one causes the other. Always interpret findings through a conceptual framework grounded in economics.
Data Bias and Revision Risk
Economic data is routinely revised. Models trained on preliminary data can embed inaccuracies. Check whether AI sources use updated series from agencies like the U.S. Bureau of Economic Analysis (BEA) or the BLS.
Model Opacity
Proprietary AI systems may not reveal their weighting or variable selection, making verification difficult. Favor tools that allow transparency or open-source inspection.
Confirmation Bias
AI often mirrors the user’s expectations. If prompted with Explain why the economy is weakening, it may overemphasize negative data. Neutral prompts—like, Summarize both bullish and bearish arguments—yield more balanced insights.
Security and Privacy
Avoid uploading sensitive financial data into public AI tools. Use anonymized or synthetic datasets when experimenting with personal portfolios.
The best practice is triangulation: Verify AI outputs against trusted sources. If an AI summary of the Beige Book highlights softening conditions, compare it with coverage from the Fed itself, major news outlets or AAII analysis.
Trust, but verify—just as you would with any analyst’s opinion.
Democratizing Economic Insight
In many ways, the rise of AI in finance represents more than a technological milestone—it’s a democratization of information power. A decade ago, large institutions used proprietary models to digest macroeconomic data before the public could react. Today, individual investors can access comparable analytical capability through browser-based tools that interpret data in seconds.
The challenge is no longer access but application. AI offers clarity when used within a disciplined framework: Gather reliable data, summarize efficiently, interpret cautiously and act deliberately.
Used this way, AI amplifies the analytical rigor that AAII has championed for decades. It allows investors to focus less on collecting data and more on interpreting relationships, forming hypotheses and stress-testing investment theses.
As AI continues to evolve, it will integrate directly into research platforms, charting software and even broker dashboards—turning raw numbers into personalized narratives.
But the timeless investing principles still apply: Diversify, stay disciplined and think long term. AI won’t replace judgment, but it can make judgment faster, broader and better informed.
Assess Recession Risks and Economic Trends With AI
Recession forecasting has always been more art than science, but AI now allows investors to easily analyze the environment. By blending economic variables, news tone and market signals, AI can turn raw data into a continuously updated view of the economy’s trajectory.
1. Synthesize Multiple Indicators
ML models can analyze leading and coincident indicators—such as GDP, unemployment, yield spreads, inflation, ISM manufacturing index and housing data—to estimate the probability of a recession within six to 12 months.
Platforms like Google Colab or Microsoft Copilot in Excel let investors build these models using historical data from the Federal Reserve Economic Data (FRED) database, revealing when risk conditions begin to cluster.
2. Turn Economic Text Into Sentiment Data
Tools such as FinBERT have been trained to read the tone of financial releases. FinBERT or Google Cloud Natural Language API can measure the tone of Fed statements, Beige Book summaries or business outlook surveys.
By charting the shift in optimism or caution in these communications, investors can detect early deterioration in economic sentiment, often months before official data confirms it.
3. Detect Inflection Points
AI time-series models can flag changes in momentum. When several sectors—e.g., manufacturing, housing and employment—show synchronized deceleration, AI dashboards can raise early warnings.
4. Build a Composite “AI Economic Index”
Investors can use AI to combine many metrics into one composite indicator. For example, ChatGPT’s Code Interpreter can normalize data from 10 leading indicators, calculate a weighted economic momentum index and compare it to past recessions.
5. Integrate Market-Based Signals
By blending macroeconomic data with yield curves, credit spreads and market breadth, AI produces nuanced recession probabilities—say, “a 28% risk of recession within six months”—that help investors adjust allocations gradually rather than react emotionally.
6. Summarize and Explain Trends
ChatGPT and other large language models (LLMs) can explain these results in plain English. For example:
“Economic momentum continues to moderate, with manufacturing softening and consumer demand steady but slowing. Yield-curve inversions and falling optimism imply elevated, though not imminent, recession risk.”
Related

AAII Sentiment Investing
Identifying Future Economic Changes With the Yield Curve
Related

Portfolio Strategies
What You Can Gain From Reading the Economic Tea Leaves
Discussion
FREE REPORT

Get your free copy of our special
report analyzing the tech stocks
most likely to outperform the
market.
No comments have been added yet. Add your thoughts to the discussion!
You need to log in as a registered AAII user before commenting.
Log InCreate an account