


Related

AAII Model Portfolios
The model portfolio’s quarterly review results in one deletion and one addition. Plus, a look at how performance differs from large caps for individual years.
by John Bajkowski | April 2026

February 2026 market performance reflected a modest shift in leadership as investor attention began to broaden beyond the mega-cap technology companies that have driven much of the market’s gains in recent years. Concerns about the potential disruptive impact of new artificial intelligence (AI) models—particularly in coding and other knowledge-based industries—contributed to selling pressure across parts of the software and technology ecosystem. At the same time, investors began to question the heavy concentration of market leadership among a small group of large technology companies, leading to profit-taking and increased volatility in some of the market’s strongest performers. Rising geopolitical tensions and signs of stress in segments of the private credit market further reinforced a somewhat cautious tone among investors.
Historically, periods of highly concentrated market leadership and significantly expanded large-cap valuations have often been followed by broader participation across the market. When this occurs, smaller and more attractively valued companies frequently begin to receive increased investor attention. While these rotations rarely unfold smoothly or predictably, early signs of a shift toward smaller companies can create a more favorable backdrop for value-oriented small-cap strategies such as the Model Shadow Stock Portfolio.
The recent escalation of the Iran war is a reminder that geopolitical events can quickly introduce uncertainty into financial markets. While such developments may increase short-term volatility, they rarely alter the long-term fundamentals that drive investment returns. For investors following a disciplined strategy, the most effective response is usually to remain patient and maintain the portfolio’s intended allocation rather than reacting to short-term market turbulence.
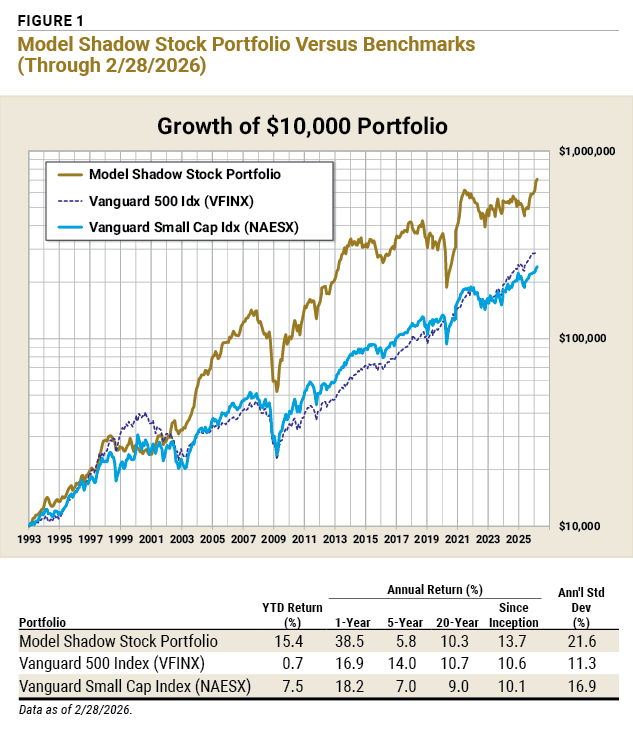
The Model Shadow Stock Portfolio is up 15.4% year to date through February, compared to a return of 0.7% for the S&P 500 index as measured by the Vanguard 500 Index fund  (VFINX). Since its inception in 1993 through the end of February 2026, the AAII Model Shadow Stock Portfolio has a compound average annual return of 13.7%, versus Vanguard 500 Index’s average annual gain of 10.6% over the same period. Vanguard Small Cap Index fund (NAESX) posted an average annual gain of 10.1% over the same period. Figure 1 shows performance over other time periods.
The Model Shadow Stock Portfolio is reviewed quarterly to determine portfolio deletions and additions. This review cycle is tied to the reporting schedule of most companies and helps limit costly portfolio turnover. AAII’s stock analysis and screening service, Stock Investor Pro, with data as of February 27, 2026, was used to determine the value and size breakpoints for the current review.
The primary selection criteria target the intersection of the smallest 10% of domestic stocks, as measured by market capitalization, and the cheapest 10% of domestic stocks, as measured by the price-to-book-value (P/B) ratio.
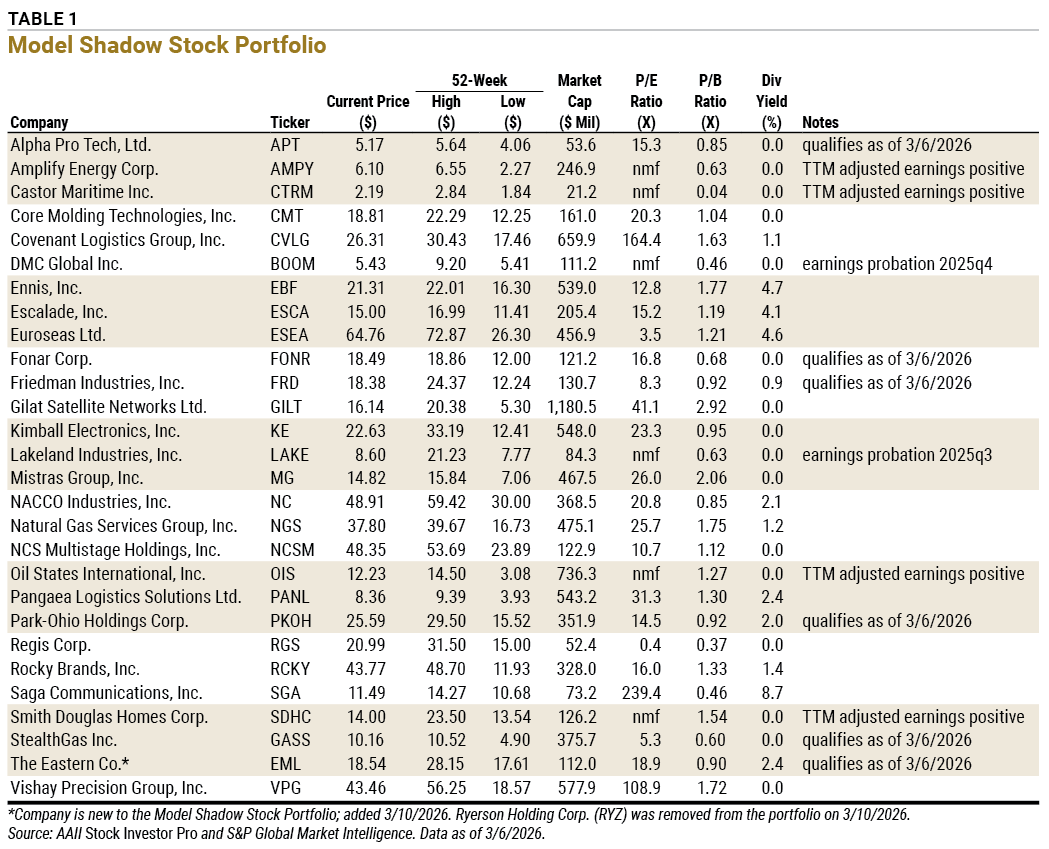
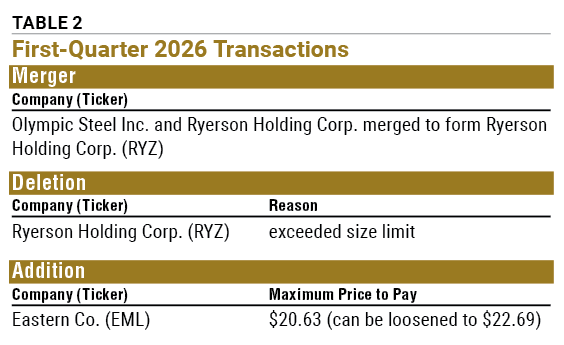
A complete list of current portfolio holdings is presented in Table 1. After the quarterly review of the Model Shadow Stock Portfolio at the beginning of March, one stock is being removed and one stock is being added (Table 2).
Approaching Size Limit: Stocks are sold if their market capitalization goes above three times the initial maximum criterion and there is a stock to replace it. The current market-cap maximum for initial screening is $400 million. Stocks are marked “approaching size limit” if their current market cap exceeds 2½ times the initial criterion, or $1.0 billion.
Approaching Value Limit: Stocks are sold once their price-to-book-value (P/B) ratio goes above three times the initial criterion and there is a stock to replace it. The current initial price-to-book ceiling is 1.00. Stocks are marked “approaching value limit” if their current price-to-book ratio exceeds 2½ times the initial criterion, or 2.50.
Earnings Probation: If the last 12 months’ earnings are negative, the stock is put on probation; if a subsequent quarter has negative earnings prior to 12-month earnings becoming positive, the stock is sold. When available, adjusted (non-GAAP) earnings are used to put stocks on probation or remove them. Otherwise, earnings from continuing operations are used. The date is the calendar quarter for which the company first reported negative trailing 12-month earnings.
Qualifies As Of: Stock still qualified as an addition when the screen was run with current data. Stocks that don’t currently qualify as an addition are held until they meet one of the deletion rules.
TTM Adjusted Earnings Positive: Trailing four-quarter GAAP earnings are negative, resulting in no meaningful figure for the price-earnings (P/E) ratio. However, adjusted earnings for the period are positive.
The price-to-book 10% cutoff increased again this quarter, rising from 0.93 in December to 0.96. The model’s qualifying maximum price-to-book ratio had remained 0.90 since March 2022, but the threshold was raised to 1.00 this quarter to reflect the general rise in overall market valuations. Stocks added to the portfolio must have a price-to-book ratio of 1.00 or less at the time of addition.
The portfolio also applies a valuation discipline for existing holdings. During each quarterly review, a stock is removed if its price-to-book ratio exceeds three times the qualifying maximum price-to-book ratio that is in effect at the time of the review.
Gilat Satellite Networks Ltd. (GILT) had the highest price-to-book ratio in the portfolio at 2.92, just below the removal threshold. No stocks in the portfolio exceeded the maximum price-to-book ratio at the time of the review.
We examined the market-cap levels of domestic companies listed on the New York Stock Exchange (NYSE) to determine the size cutoff for the lowest decile when adding stocks to the model portfolio. The lowest-decile market-cap level remained unchanged at $400 million, and we maintained the maximum initial qualifying market-cap value at $400 million.
As part of the portfolio’s size discipline, holdings are removed if their market cap rises above three times the initial qualifying threshold ($1.2 billion) at the time of review.
Portfolio Deletion: Ryerson Holding Corp.
Ryerson Holding Corp. (RYZ) had the highest market cap in the portfolio at $1.29 billion, exceeding the maximum threshold. Ryerson Holding entered the portfolio following its February merger with Olympic Steel Inc. Ryerson Holding is being removed from the portfolio due to its market cap. The company had an adjusted cost basis from its Olympic Steel merger of $18.1907 per share. It was deleted on March 10, 2026, at $23.638 per share, for a price gain of 29.9%.
If a company has trailing 12-month earnings from continuing operations that are negative, the stock is placed on probation; if a subsequent quarter has negative earnings prior to trailing 12-month earnings becoming positive, the stock is deleted. When available, adjusted (non-GAAP) earnings are used to put stocks on probation or remove them.
Small-cap companies have additional time to file their fiscal year-end financial statements. While larger companies must file their annual reports with the U.S. Securities and Exchange Commission (SEC) within 60 days of year-end, small firms have 90 days to file. The deadlines are shorter for filing quarterly statements: Large companies must file their quarterly reports within 40 days of the quarter-end, while smaller firms must file within 45 days. As a result, not all of the Model Shadow Stock Portfolio holdings released their year-end statements at the time of the review.
DMC Global Inc. (BOOM) went on earnings probation this reporting season after posting a loss for a second consecutive quarter. Lakeland Industries Inc. (LAKE) remains on earnings probation after reporting negative earnings for its quarter ending October 31, 2025.
As of March 6, 24 stocks met the initial selection criteria for the Model Shadow Stock Portfolio. AAII members can see and research which companies are currently passing the initial selection criteria in the Shadow Stock Ideas table on AAII.com. The list of new Shadow Stock Ideas is updated daily—Tuesday through Saturday.
Five qualifying stocks were already in the Model Shadow Stock Portfolio at the time of the review. The remaining 19 stocks were examined to ensure adequate liquidity, timely financial filings, and appropriate industry and foreign considerations. The Shadow Stock Portfolio rules on AAII.com provide guidance on factors to consider when selecting stocks for your portfolio.
With the proceeds from the deletion, as well as the cash held in the portfolio, the Model Shadow Stock Portfolio was able to take a position in one company, although it was below the average position size for the existing holdings in the tracking portfolio.
Eastern Co. (EML) designs, manufactures and sells engineered solutions for industrial markets across North America. The company provides turnkey returnable packaging solutions used in the assembly of vehicles, aircraft and other durable goods, as well as in the production of plastic packaging products, packaged consumer goods and pharmaceuticals. It also develops and manufactures injection blow mold tooling and two-step stretch blow molds and related components used in the stretch blow molding industry. It supplies blow molds and change parts to customers in the food, beverage, health care and chemical industries.
Eastern Co. also produces a range of industrial hardware products, including rotary, compression and draw latches, as well as hinges, camlocks, key switches, padlocks and handles. In addition, the company provides development and program management services for custom electromechanical and mechanical systems for original equipment manufacturers (OEMs) and other customer applications.
The company also designs and manufactures proprietary vision technology for OEM and aftermarket applications and supplies aftermarket components to the heavy- and medium-duty truck, motorhome and bus markets. Eastern Co. was founded in 1858 and is headquartered in Shelton, Connecticut.
As of January 3, 2026, Eastern Co. had a book value of $20.63 per share. To remain within the model portfolio’s initial 1.00 price-to-book maximum, investors should pay no more than $20.63 per share ($20.63 x 1.00). However, if the stock price has risen since being added to the portfolio, shares may still be purchased until the price-to-book ratio reaches 1.10, which corresponds to a price of approximately $22.69 per share.
Small-cap stocks, such as those held in the Model Shadow Stock Portfolio, often follow a cycle that differs somewhat from large-cap stocks, represented by the S&P 500. Using January returns as a signal for the rest of the year’s performance, we can compare how the two behave.
Table 3 presents a January Barometer analysis by showing year-by-year performance for both the Model Shadow Stock Portfolio and Vanguard 500 Index. The table presents five columns of data for each portfolio. The first column shows January’s total return, followed by the return for the remainder of the year and the combined total return for the full year. The next column uses “X” marks to note the years in which January’s performance failed to correctly signal full-year results. Because January performance can have a meaningful impact, the final column calculates returns assuming you were always invested during January but moved to cash for the remainder of the year whenever January’s return was negative.
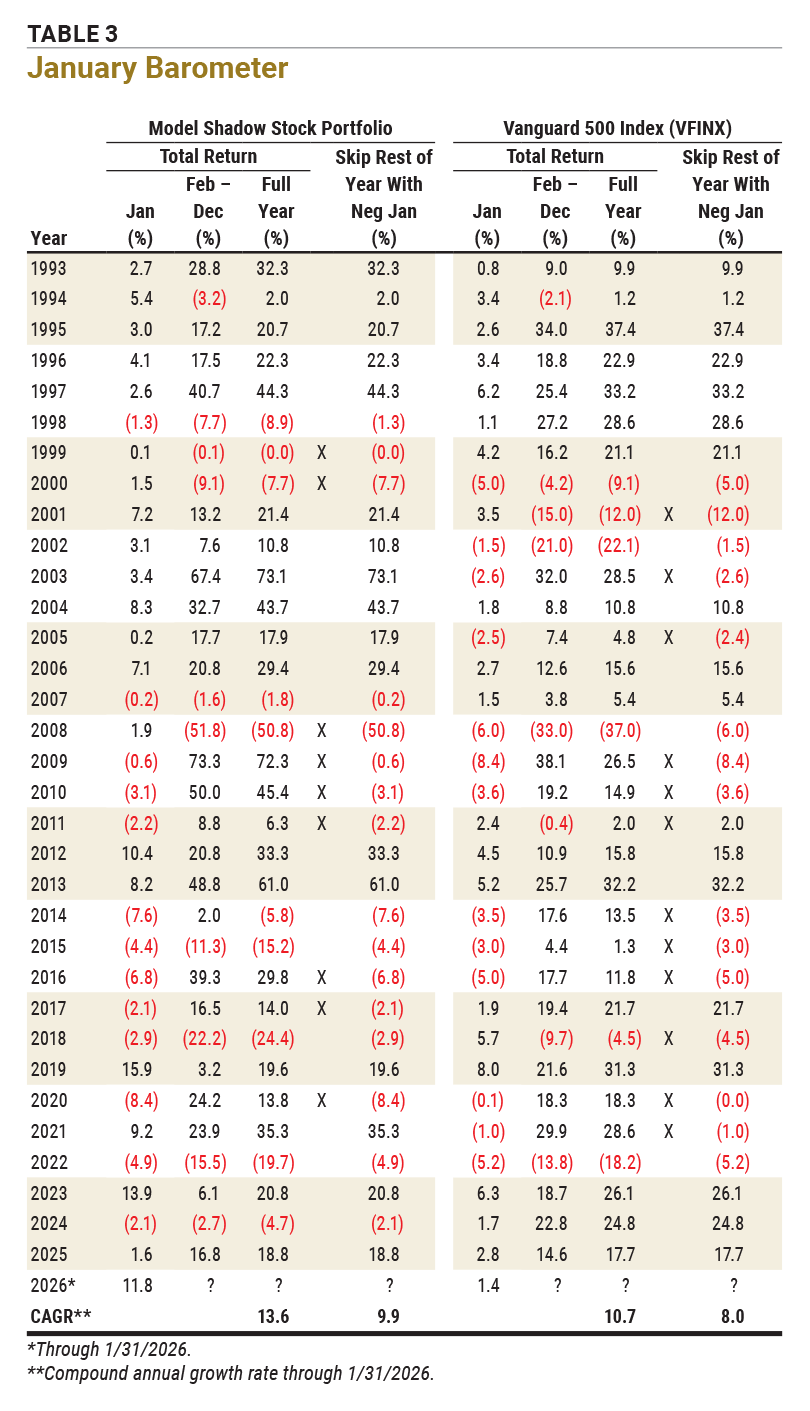
Overall, both the Model Shadow Stock Portfolio and Vanguard 500 Index recorded 13 January losses. However, examining individual years shows that January’s signal differed between the two investments in more than one-third of the periods, highlighting how differently the portfolio and the S&P 500 can behave over time.
The final column of the table seeks to answer whether investors could have benefited from acting on the January Barometer for the Model Shadow Stock Portfolio. Over the past 33 years, however, any gains from following the signal were outweighed by missed opportunities—either being out of the market during strong rebounds following weak Januarys or remaining invested after positive Januarys that were followed by poor full-year results.
Some of the most impactful misses for the Model Shadow Stock Portfolio occurred during the Great Recession and its aftermath. The portfolio gained 1.9% in January 2008 but went on to lose 50.8% for the year. The following year, the portfolio declined 0.6% in January yet finished 2009 with a gain of 72.3%.
Across its full history through the end of January, the Model Shadow Stock Portfolio has generated a compound annual return of 13.6%. However, investing in January and moving to cash for the remainder of the year whenever January was negative would have reduced the portfolio’s annualized return to 9.9%.
Similarly, Vanguard 500 Index produced a 10.7% annualized return when fully invested. Following the January Barometer strategy would have lowered the return to 8.0%.
It is important to distinguish the January Barometer from the January Effect, which is the observation that smaller, out-of-favor companies often experience strong performance early in the year. Additionally, these calculations do not account for the transaction challenges associated with trading the less-liquid stocks that often make up the Model Shadow Stock Portfolio universe.
What the January Barometer shows is that the Shadow Stock approach remains best suited for investors willing to take a long-term perspective and tolerate the higher volatility that accompanies smaller-company investing, including periodic stretches of underperformance.
The next quarterly review of the Model Shadow Stock Portfolio will take place following the release of first-quarter 2026 results at the beginning of June. If there are any changes to the model portfolio, they will be announced at that time in the monthly Model Shadow Stock Portfolio Update email. Sign up for this email so you don’t miss it!
AAII Model Portfolios

AAII Model Portfolios


BARRY J from TX posted 6 months ago:
JAMES D from PA posted 6 months ago:
JEAN H from IL posted 5 months ago:
You need to log in as a registered AAII user before commenting.
Log InCreate an account