

Related

AAII Sentiment Investing
The Fed Model offers a simple and intuitive way to compare stock and bond valuations, but its theoretical and practical weaknesses need to be understood.

Charles Rotblut leads a class in AAII's new Essential Investing Video Course. Go to https://www.aaii.com/ves for more information and to subscribe.
When stock prices seem disconnected from fundamentals, investors naturally search for models or frameworks to make sense of the chaos. One of the simplest and most widely cited frameworks is the Fed Model. By comparing stock market earnings yields to U.S. Treasury bond yields, the model attempts to determine whether equities are cheap or expensive relative to fixed income.
Understanding what the Fed Model can and cannot tell you is essential. Used properly, it can provide helpful context about market conditions. Used in isolation, it can lead to poor investment decisions.
The Fed Model compares the earnings yield of stocks to the yield on long-term U.S. government bonds, typically the 10-year Treasury note. The idea is rooted in the notion that stocks and bonds compete for investor capital. If one offers a higher yield than the other, it should be more attractive.
The earnings yield is the inverse of the price-earnings (P/E) ratio. Rather than dividing price by earnings as the price-earnings ratio does, the earnings yield divides earnings per share by price. If a stock has a price-earnings ratio of 25.0, its earnings yield is 4.0% (1 ÷ 25.0 = 0.04).
The concept itself can be traced back to Benjamin Graham, who argued that stocks should offer an earnings yield at least as high as high-grade bond yields to be considered attractive. Notably, the term “Fed Model” was not coined by the Federal Reserve, but rather by Edward Yardeni when he worked as an analyst for Deutsche Morgan Grenfell in the late 1990s. The Fed commented that stock valuations based on forward-looking earnings were rising relative to bond yields. Yardeni called this the Fed’s Valuation Model.
At its core, the model rests on a simple relationship:
Bond yields are affected by current and expected inflation. Bond yields are high when inflation is high and fall as inflationary pressures weaken. The Fed Model therefore ties stock valuations to inflation. Low inflation rates allow stocks to appear cheap even at higher price-earnings ratios. High inflation rates and higher bond yields indicate that stocks need to have lower price-earnings ratios (equal to higher earnings yields) to be attractive on a relative basis.
The Fed Model functions best as a relative valuation tool: It gauges how attractive equities look relative to bonds at a moment in time. This comparison provides a quick way to assess whether equities are offering sufficient return relative to safer alternatives.
The Fed Model’s appeal extends beyond simple buy or sell decisions. It can be used to guide strategic asset allocation decisions, portfolio rebalancing or tactical portfolio adjustments. The framework promises to cut through market noise and focus on a fundamental relationship between competing asset classes.
The Fed Model compares two simple variables:
The choice between trailing and forward earnings can impact readings. Trailing earnings, which are used in Figure 1, can be depressed because of temporary disruptions to the economy, such as at the end of 2020 when historical earnings were significantly depressed from the impact of the pandemic.
![Figure 1 Earnings Yield vs. 10-Year Treasury Yield This line chart shows the S&P 500 index earnings yield [inverse price-earnings (P/E) ratio] and 10-year Treasury yield over time.](https://www.aaii.com/images/journal/469814-figure-1.png)
In its most basic form, the Fed Model relationship is:
E/P = Y
Where:
Assume the S&P 500 index is trading at 6,768 and its earnings are $277.70 per share. This equates to a price-earnings ratio of 24.4 (6,768 ÷ $277.70). If we were to flip the equation so that it calculates the earnings-to-price ratio ($277.70 ÷ 6,768), we would get an earnings yield of 4.1%.
If the 10-year Treasury note was also yielding 4.1%, we could say that stocks are fairly valued because the earnings yield equals the bond yield.
The equation for the Fed Model can also be stated as:
P/E = 1 ÷ Treasury Yield
Though we end up in the same place, this second formulation suggests that the S&P 500’s price-earnings ratio should be the inverse of prevailing interest rates (i.e., 10-year Treasury bond yield). When interest rates are 4.1%, the fair value price-earnings ratio should be 24.4. When interest rates fall to 2.5%, the fair value price-earnings ratio could expand to 40.0 and still be attractive on a relative basis.
This formulation highlights the Fed Model’s central implication: Interest rates influence what constitutes a “reasonable” valuation. When rates fall, higher price-earnings ratios may be justified. When rates rise, lower price-earnings ratios are required for stocks to remain attractive.
Figure 2 displays the S&P 500 and the Fed Model values calculated using trailing earnings. The Fed Model value is determined by subtracting the 10-year Treasury note yield from the earnings yield (E/P – Y). When the Fed Model value is positive, stocks are considered more attractive relative to bonds. When the Fed Model value is negative, earnings yields are lower than Treasury bond yields and are less attractive on a relative basis. At the end of 2025, the S&P 500 earnings yield was 3.7% while the 10-year Treasury note yield was 4.1%, resulting in a Fed Model value of –0.4% (3.7% – 4.1%).
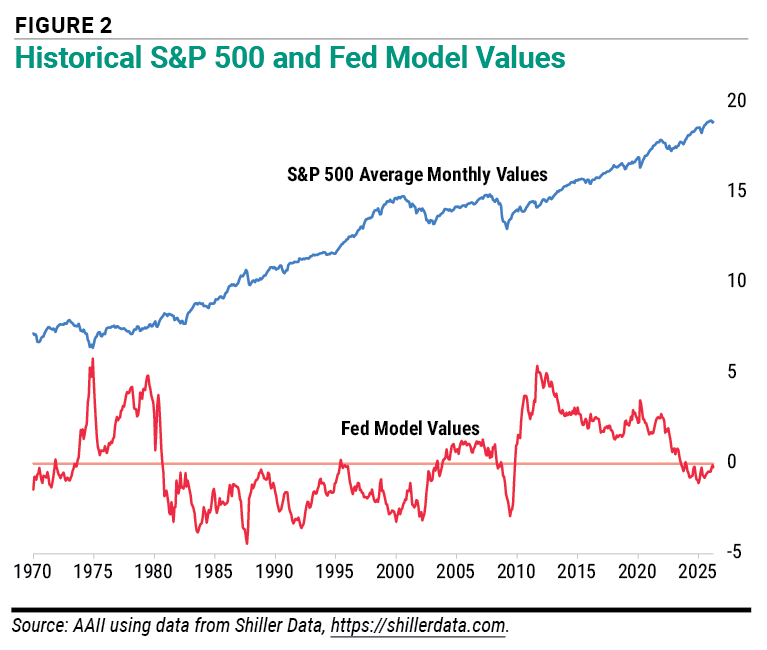
The Fed Model therefore implicitly ties stock valuations to inflation and monetary policy. Low-inflation environments tend to support higher valuations, while high-inflation environments require stronger earnings yields to compensate investors.
The fair value of the S&P 500 can be calculated from this relationship by dividing the expected earnings per share by the yield on the 10-year Treasury note if you assume that fair value exists when the earnings yield equals the bond yield.
The equation for the Fed Model fair value can also be stated as:
Earnings Per Share ÷ Treasury Yield = S&P Fair Value
$277.70 ÷ 0.041 = 6,773.17
Figure 3 plots the ratio of the S&P 500 to the Fed Model fair value minus 1. Normally, levels below zero are considered undervalued, while ratios above zero are considered overvalued. Figure 3 also plots bands showing the usual range of the ratio (+/– one standard deviation to the average of the ratio). The chart uses trailing earnings to calculate the underlying Fed Model fair value. The high spike in 2009 and the overvaluation reading during the Great Recession highlight the risk of using trailing earnings to calculate valuations. Depressed historical earnings were not representative of future expectations.
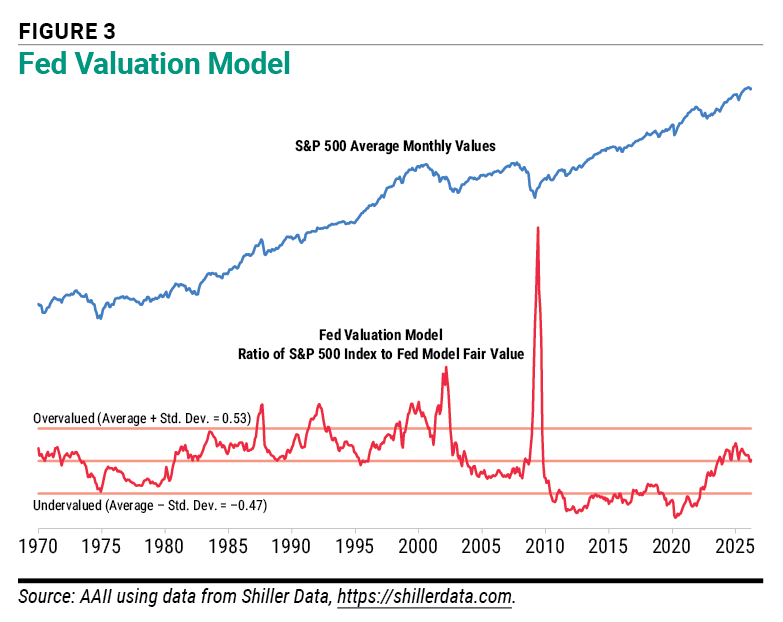
FactSet reports a bottom-up 2026 earnings estimate of $323.29 per share as of April 17, 2026. Using the S&P 500 closing price on April 21, the forward earnings yield would be 4.6% ($323.29 ÷ 7,064.01). With the 10-year Treasury note yield averaging 4.31% during April, the S&P 500 is attractive at face value. Dividing the expected $323.29 earnings per share by the 10-year Treasury yield produces a Fed Model fair value of 7,500.93, roughly 5.8% above the S&P 500’s close of 7,064.01 on April 21. This assumes that analysts are correctly assessing the strong 19% growth in year-over-year S&P earnings this year.
The Fed Model’s popularity stems from its simplicity and intuitive logic. Investors are constantly deciding how to allocate capital, and the model provides a straightforward comparison between two major asset classes.
It can be used to:
In theory, the model cuts through market noise and focuses on a fundamental trade-off: the relationship between equity returns and bond income.
Despite its appeal, the Fed Model has both theoretical and practical weaknesses.
One major criticism is that the model compares fundamentally different types of yields:
This creates an inconsistent comparison; one yield is dynamic and uncertain, while the other is fixed and contractual.
For the model to work in theory, several assumptions must hold. The Fed Model effectively assumes that:
In reality, companies reinvest earnings, dividends often grow and investors demand a higher return from stocks due to their greater risk.
Stocks and bonds differ fundamentally in risk:
By equating their yields, the Fed Model overlooks the equity risk premium—the additional return investors require for holding stocks instead of risk-free bonds.
Over certain periods—particularly from the late 1960s through the mid-2000s—earnings yields and bond yields moved together. However, the relationship has not been consistent over time.
The Fed Model has had periods of apparent success. For example, it indicated that stocks were relatively attractive during the market decline in early 2020, when falling interest rates boosted the relative appeal of equities.
However, its failures are equally instructive. During the Great Recession, the model suggested that stocks were attractive even as economic conditions deteriorated. Conversely, it signaled that equities were expensive early in the subsequent bull market, potentially discouraging participation in the recovery.
These examples highlight a key issue: The Fed Model often struggles at major turning points when earnings projections vary widely.
Given these limitations, the Fed Model is often used more as a sentiment indicator than as a strict valuation tool. Extreme readings frequently reflect shifts in investor psychology.
Viewed this way, the model helps gauge how investors are pricing risk, inflation and future growth expectations.
The Fed Model is most effective when combined with other indicators.
The strongest signals tend to occur when multiple indicators align—particularly during periods of excessive pessimism or optimism.
The Fed Model offers a simple and intuitive way to compare stock and bond valuations, and its appeal lies in that clarity. But markets are rarely that simple.
When used thoughtfully, the Fed Model can highlight shifts in sentiment, inflation expectations and relative valuation pressures across asset classes. But successful investors recognize that no single indicator tells the full story. Instead, they rely on a combination of tools to build a comprehensive view of market conditions.
Used in that context, the Fed Model becomes what it should be: not a definitive answer, but a useful input in a disciplined investing process.
AAII recently launched a new Sentiment Investing Dashboard to help you interpret and apply sentiment indicators. It includes 10+ indicators measuring investor sentiment and market sentiment, breadth, valuation, trend and volatility—including the Fed Model. Find out more at AAII Sentiment Investing.
AAII Sentiment Investing



JOHN L from NJ posted 5 months ago:
ROBERT A from NC posted 5 months ago:
You need to log in as a registered AAII user before commenting.
Log InCreate an account