
Mapping the Safe Zone of Retirement Withdrawal Rates

An analysis of three retirement portfolios over 100 years addresses the tension between portfolio longevity and lifestyle goals.

  • Addresses balancing two retirement fears: running out of money vs. missing out on desired lifestyle
  • Analyzes withdrawal rates from 3% to 8%, showing generally safe levels before risk increases and ending balances fall
  • Emphasizes disciplined investing, patience and sticking to allocations as key to sustaining retirement income

There are two common fears that retirees may have regarding their portfolios.

  • Retirement Fear #1: Running out of money before dying.
  • Retirement Fear #2: Not having enough money to maintain a desired lifestyle.

In dealing with Fear #1, there may be a tendency to “under-withdraw” from one’s retirement portfolio [if the required minimum distribution (RMD) is not applicable].

However, in dealing with Fear #1, Fear #2 might be realized—meaning that the portfolio withdrawal rate may not be high enough to achieve the desired retirement lifestyle.

Is this a classic “rock and hard place” scenario? Probably not. Let’s review various portfolio withdrawal rates to determine what constitutes the zone of “safe” withdrawal rates.

We use annual withdrawal rates from 3% to 8%. A 3% annual withdrawal rate means that you withdraw 3% of your portfolio’s total value at the end of each year. For example, if your portfolio’s year-end value was $1 million, you would withdraw $30,000, or 3% of $1 million. If your portfolio grew in value during Year 2 to $1.2 million, the 3% withdrawal would be $36,000. On the other hand, if your portfolio suffered a loss and had a year-end value of $900,000, the 3% withdrawal would be $27,000.

Three Retirement Portfolio Allocations

The retirement portfolios in this analysis were each assigned a starting value of $1 million. There were 25 year-end withdrawals (from age 65 to age 90). The portfolio was rebalanced annually. The returns of each asset class were based on well-known indexes over the 100-year period from 1926 to 2025. Since indexes do not have expense ratios, a 50-basis-point fee was subtracted from the annual returns to simulate an expense ratio for a realistic portfolio.

The results shown in Table 1 for three retirement portfolios are drawn from the analysis of 76 rolling 25-year periods from 1926 to 2025. Portfolio 1 consists of 40% large-cap U.S. stocks, 20% small-cap U.S. stocks, 30% bonds and 10% cash. For this portfolio, the $74,454 average annual withdrawal assuming a 3% annual withdrawal rate is the average of 1,900 annual withdrawals (or 76 rolling periods multiplied by 25 years in each period).
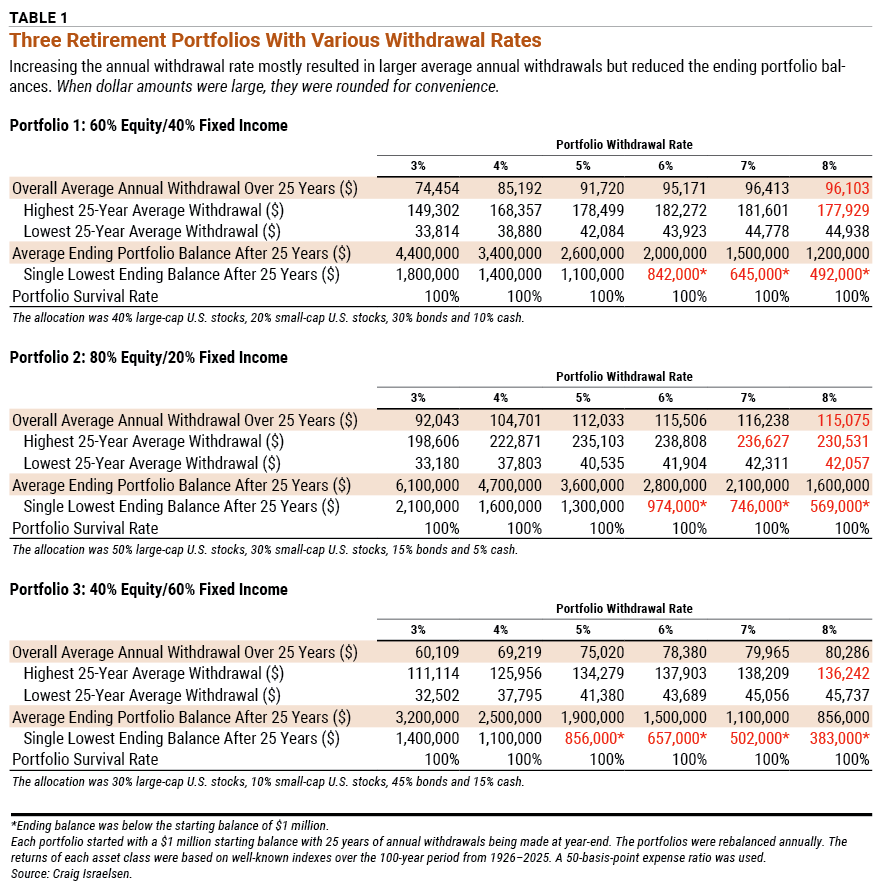
table 1 Three Retirement Portfolios With Various Withdrawal Rates

What else do we observe in Portfolio 1? For starters, in a 60% equity/40% fixed-income portfolio, annual withdrawal rates from 3% to 8% had 100% success. In this case, success means that the portfolio never ran out of money within 25 years. Fear #1 (running out of money) is resolved, at least for 25 years.

But look at the average ending balances—they’re huge. It is highly unlikely that a retiree would run out of money within 35 years … or even over a period of 40 years. The lowest ending balance after 25 years of withdrawals was larger than the starting balance if an annual withdrawal rate of 5% or less was employed. Put another way, a retiree with this hypothetical portfolio would leave a lot of money on the table that could be used to support their lifestyle and other spending desires during retirement.

Portfolio 2 is a more aggressive 80% equity/20% fixed-income portfolio. On the other side of the risk spectrum, Portfolio 3 shows the outcomes for a 40% equity/60% fixed-income portfolio.

Results of a 3% Withdrawal Rate

At a 3% annual withdrawal rate, the average annual withdrawal for a 60% equity/40% fixed-income retirement portfolio was $74,454 and the average ending balance was $4.4 million—which is amazing considering that the starting balance was $1 million. Obviously, some of the ending balances were below $4.4 million, but you might be interested to know that the lowest ending balance (across the 76 rolling 25-year withdrawal periods) was $1.8 million.

Using the more aggressive 80% equity/20% fixed-income allocation or the more conservative 40% equity/60% fixed-income allocation also resulted in large ending balances.

The average annual withdrawal for an 80% equity/20% fixed-income retirement portfolio using a 3% withdrawal rate was $92,043, and the average ending balance was $6.1 million.

The average annual withdrawal for a 40% equity/60% fixed-income retirement portfolio was $60,109, and the average ending balance was $3.2 million. Not surprisingly given its large weighting toward bonds, this allocation had the narrowest spread between its highest and lowest average withdrawal rates of the three allocations.

Regardless of which allocation was used, the 3% annual withdrawal rate has been very safe.

Using a 4% Withdrawal Rate

Perhaps a 3% withdrawal rate does not produce quite enough money to cover your desired retirement lifestyle (Fear #2). So, you decide to withdraw 4% each year.

A 4% annual withdrawal rate produced an average annual withdrawal of $85,192 in a 60% equity/40% fixed-income portfolio—representing an increase of almost $11,000 per year compared to a 3% annual withdrawal rate. However, the average ending balance after 25 years of withdrawals dropped by $1 million (from $4.4 million to $3.4 million). Still, the average of $3.4 million remaining after 25 years of withdrawals is fantastic! Perhaps more comforting is that the lowest ending balance in Year 25 with a 4% annual withdrawal rate was $1.4 million—or $400,000 more than the starting balance of $1 million.

Withdrawals rates increased and average ending balances decreased for the other two allocations as well. A 4% annual withdrawal rate produced an average annual withdrawal of $104,701 for an 80% equity/20% fixed-income retirement portfolio. The average ending balance was $4.7 million. The 40% equity/60% fixed-income portfolio had a $69,219 average annual withdrawal and an average ending balance of $2.5 million.

As you can see, an annual withdrawal rate of 4% is also very safe.

Important note: These results are based on the assumption that the retiree maintained their chosen stock/bond allocation each and every year during their 25-year withdrawal period—no bailing out to cash when markets got choppy.

Withdrawal Rates of 5% or Higher

If the 4% withdrawal rate doesn’t provide you with enough income, what about using a higher withdrawal rate? Let’s start by looking at a 5% withdrawal rate. The average annual withdrawal in a 60% equity/40% fixed-income portfolio increased to $91,720, and the average ending balance in Year 25 decreased to $2.6 million.

Is the increase in the average annual withdrawal sufficiently large to justify the $800,000 decline in the average ending balance? That’s a personal judgment call. But, when I also observe that the smallest ending balance with a 5% withdrawal rate was $1.1 million, I feel pretty good about the trade-off. If we assume that a 60% equity/40% fixed-income portfolio was consistently adhered to, a 5% annual withdrawal rate is in the safe zone.

Only the 40% equity/60% fixed-income portfolio had a single lowest ending balance below $1 million at the end of 25 years: $856,000. However, its average ending portfolio balance after 25 years was $1.9 million.

Annual withdrawal rates of 6% and above start to leave the safe zone.

For instance, at a 6% withdrawal rate, the average annual withdrawal for the 60% equity/40% fixed-income allocation improved by nearly $3,500 but the average ending balance declined by $600,000. The lowest ending balance dipped to $842,000, below the starting balance of $1 million.

Is 6% a safe annual withdrawal rate? It probably is, but the average ending balance after 25 years of withdrawals in the 60% equity/40% fixed-income portfolio was lower than the starting balance in 5% of the rolling 25-year periods. So, we are starting to observe signs of the stress imposed by a 6% withdrawal rate.

This increased level of stress is even more evident in the 40% equity/60% fixed-income portfolio, where the lowest ending balance was $657,000. The lower amount of growth attributable to the larger bond allocation made it harder for the portfolio to sustain the withdrawal rate during 25-year periods with tougher market conditions.

At a 7% annual withdrawal rate, the improvement in the average annual withdrawal is negligible for all three allocations. For example, the 60% equity/40% fixed-income allocation only increased $1,242 in the average annual withdrawal. Meanwhile, the average ending balance declined by $500,000. The lowest ending balance in Year 25 was $645,000, and the ending balance was below the starting balance 17% of the time.

The 80% equity/20% fixed-income portfolio showed even more strain under a 7% withdrawal rate. Its lowest average annual withdrawal of $42,311 was below that of both the 60% equity/40% fixed-income and the 40% equity/60% fixed-income portfolios.

It’s hard to justify a 7% annual withdrawal rate because there is simply not enough improvement in the average annual withdrawal.

At an 8% withdrawal rate, the average annual withdrawal, as well as the average ending balance, actually declined for both the 60% equity/40% fixed-income and the 80% equity/20% fixed-income portfolios, as noted by the red type. The average withdrawal for the 40% equity/60% fixed-income portfolio was only marginally higher at 8% relative to 7%, yet the average ending balance was much lower. Hence, there is absolutely no motivation for a retiree to impose an 8% withdrawal rate for any of these allocations.

Courage and Patience Matter

Here is a closing thought that is likely the most valuable part of this article: The most important assets in a retirement portfolio are courage and patience. We need to give our retirement portfolio the time it needs to do its job. We must not over-manage it. And we can’t bail out when we get scared.

A broadly diversified retirement portfolio will have far more up years than down years, but it will have down years. We must remember that and not act “shocked and surprised” when the portfolio balance drops during a market downturn. Stay with the portfolio; it will recover. During nasty downturns, we should make our withdrawals from the cash “pantry” that we established and let our investment portfolio heal and recover.

In short, as a farmer friend once told me while we were standing near a piece of farm machinery struggling to pull another piece of machinery, “… let the metal do its job!” In other words, once you build a thoughtful retirement portfolio, leave it alone and let it do its job. 

Discussion

ROBERT A from NC posted 2 months ago:

My takeaway from this is that the portfolio with the highest percentage of equities provided highest ending balance and the highest average withdrawals. I'm so glad I've maintained 100% equities all my investing life!


JOHN C from MA posted 2 months ago:

Question is : are you getting an incrementally more return for added risk of 100% equity exposure or are you buying more risk without getting properly compensated for this added risk????? john


ROBERT A from NC posted 2 months ago:

John C: There is no "added risk" in having a 100% equities portfolio. That's a myth. It should be obvious that holding bonds presents a practical CERTAINTY that your portfolio will underperform the stock market in the long run. I've been in this game for the long run from the moment I bought my first stock. And, yes, I have been very, VERY well compensated for adhering to this methodology. As James Cloonan put it, “[T]he success of a strategy that is 100% in equities all the time is largely dependent on having done that from the beginning of your investment career. If you have used a 60% stocks/40% bonds strategy through the years, you probably will not have built up the higher portfolio value to see you through any major downturn during the withdrawal stage.”


JOHN L from NJ posted 2 months ago:

100% Equity investing for a lifetime in my opinion is the "winning" strategy but it requires emotional and mental strength. Not just patience to wait out bear market drops. But also to recognize during big bull markets (like now) that the market is probably over valued and the market value of the stock portfolio is likely to decline in the future. Any withdraw scheme needs to recognize that taking out 4% per year in retirement is likely to be problematic if the market is over valued. Plan for a probable decline by reducing the withdraw rate and retirement will be worry free.


ROBERT A from NC posted 2 months ago:

Very well said, John L! Maintaining a prudent level of frugality is an essential ingredient for successful investing and a happy retirement.


JOHN M from VA posted 2 months ago:

I would like to know the following:(1) what was the average rate of returns for the various portfolios; (2)what results if extended for 35 years; (3) using a RMD for ages 73-108. ( a withdrawal rate of the Greater of the RMD or stated rate). Also, I’d be interested in comments on using an annuity, either an immediate or deferred QLAC, in an IRA as a part of the bond allocation or in lieu of bonds? I’m retiring and starting withdrawals from my regular IRA as I’m 73. I want to draw from it for my lifetime and then leave it for my wife’s and she is 5 years younger. I want to get the say up to 5%, out of it but safely have it last for a 30 or 35 year run. A large balance on the survivor’s death is nice but not the goal as I see that as a tax problem for my heirs. I’d prefer to spend it (vs other funds) and have the Roth accounts grow and pass Roth and non IRA funds to my children. Simplicity and sleeping well are more important to me than the max provided by using a 100% equity approach. An 80/20 or even a 60/40 approach is more preferable for me. Any thoughts?


VICTOR S from NC posted 2 months ago:

Interesting and informative article. However, my withdrawal percentage is something I monitor as each year rolls by rather than use to determine how much to withdraw. I use two tools each year: a Monte Carlo based portfolio projection based on estimated expenses using decades of historical data (Fidelity has a really good one) and last year's tax software. Early in each year I load up the tax software with income estimates for that year (pension, SS, interest, dividends, withdrawals from taxable brokerage account, etc.) and update it quarterly. When the following April 15 rolls around I'm within a few hundred dollars at most of the final result for each line on the 1040. The last two years and the next two have me doing Roth conversions before RMDs kick in. The software helps me stay below the next bracket threshold (not yet approaching the next IRMAA tier/cliff). Withdrawals starting in 2016 were: 5.2%,3.9%, 6.2%, 4.8%, 4.4%, 4.0%, 5.8%, 0.0%, 0.0%, and 0.0% (the last three are zero because of taxable withdrawals from brokerage account, both to live on and pay taxes on the Roth conversions).


CHARLES M from NY posted 2 months ago:

This analysis uses 'average withdrawal' as the primary optimization goal. However note how much the annual withdrawals move around. In retirement, can you 'afford' to go from the average $70k+ down to the minimum in the $30-40k range when the market takes a serious dip? Most of us can't, so we'll probably 'bank' overages in good years to tide us over the bad years or over-withdraw in the bad years. Surprisingly, the minimum withdrawals are not stongly affected by the portfolio mix. Is there some year in the analysis periods where both equity and fixed income were down a lot? No mention of inflation. At 3%/yr, your $1M is going to be worth less than $500k in purchasing power after 25 years, affecting your lifestyle as well as the value passed on to heirs.


BARRY J from TX posted 2 months ago:

#1 Some really good critiques and analyses here in these comments. #2 Why is it that only the folks who (1) keep records, (2) analyze their income streams, (3) compare/manage the opportunity costs of their lifestyles, and (4) continuously monitor their plans … can respond wisely to this supposed Gordian knot? #3 PS: It’s only a knot because of (A) the constant and insidious siphoning off of returns through various fees in investment accounts, and (B) the numerous and complex tax laws passed when the Boomers turned 65 to tax away investment returns. #4 The shared “clues” in these comments for managing the dilemma of (A) running out of money (“ROOM”) versus (B) running out of time over (“ROOT”) are right here in these comments. (1) Pay attention. There will be math on the yearly quizzes and the final exam. (2) Plan. (3) Save. (4) Invest. (5) Reinvest. (6) Stay invested. (7) Budget. (8) Replan. (9) Breathe in. Breathe out. (10) Move on. Thanks, Robert A, John L, John C, John M, Victor, and Charles.


BARRY J from TX posted 2 months ago:

Craig, once again, I enjoyed having you turn in my/our homework for me/us. #1 Maybe the solution to “courage”/“patience” requirements is for every retiree to get a “4%” tattoo on a body part to remind them of their safe zone and a 6% tattoo on the zone they reach for when their fear of “ROOM” activates. #2 As I was following your analyses of the INCREMENTAL CHANGING “risk” generated by the progressive changes from a 4% to a 7% withdrawal rates that INCREASED the “risk” of not achieving a “safe” withdrawal rate AND/OR breaking below "running out of money" (“ROOM”) threshold for an ending balance below the “margin safety.” #3 Your analyses rely on standard statistical frequentist probabilities. I like to think in Bayesian probabilities. It helps me estimate how [let’s say year-over-year, for example] changes alter my [financial] position. #4 The Good Reverend Bayes estimated where his billiard ball was after it moved due to changes in its position. #5 His complicated formula can be simplified and reduced to 3 factors – prior position (“before”), a numerical change in position (“a known change”), and the posterior (“after”) position. #6 These 3 data points can be used to calculate/triangulate the PROBABILITY of the NEW position after a change (say year-over-year, as you did here). #7 Updated probabilities help me track HOW the probabilities of “RISK” are changing within [Ben Graham’s famous] “margin of safety” requirement. #8 Perhaps you would like to consider this your next AAII article to help your growing AAII following develop some rules of thumb [heuristics] that would help them estimate how changes increase/reduce the probabilities they will remain within their “margin of safety.” Thank you again for delivering some practical education to help AAIIers achieve their goals.


ADAM G from MA posted 2 months ago:

I take issue with the premise of these calculations in that many people wish to establish an initial % output and add an annual "COLA for inflation. It would be useful to see these calculations modified by perhaps 2 or 3% annual increases in distributions.


VIRGINIA S from NC posted 2 months ago:

Please address sequence of return risks during the five years before and five years after retirement.


JOHN L from NJ posted about 1 month ago:

Virginia S - "Sequence of returns risk" is the term efficient market believers use to disguise the fact that stock markets go through long cycles of over and under valuation which disproves the efficient market hypothesis. During long secular bull markets which last approximately 20 years, stock market valuations grow and during secular bear markets which last approximately 15 years, stock market valuations shrink. The stock market being volatile during these long secular periods can and does drop or increase by large percentages (20% or more). According to the standard but useless definitions these movements are also called bull and bear markets. And the risk of these movements five years before or after retirement can be temporarily (several years) painful. But the real risk is when the stock market changes from a secular bull to a secular bear. Then you are looking at 10 to 15 years of poor returns. Pity the poor retiree who started their retirement in 1929, 1966, or 2000. The stock market was grossly overvalued in these years. Future returns were poor over the next 10 to 15 years. The only protection is to reduce the withdraw rate to 3%. And that is no fun and unbelievable to retirees who have just experienced a long period of higher than average returns and want to believe this will continue. And the bad news is that valuations in the stock market are currently quite high and have been growing since 2009 (17 years ago). When the current secular bull changes to a secular bear sometime in the future, it will be a bad time to retire unless you can live with an initial 3% withdraw rate and then adjust for inflation!


ROBERT A from NC posted about 1 month ago:

John L provides wise advice. Just the other day, I read a Kiplinger's Personal Finance article bemoaning the fact that so many retirees "underspend"! I think that's CRAZY! Through 15 years of retirement, my assets have increased (very nicely) in value, so my permissible spending, in dollars, has also increased. However, my spending RATE (as a percentage of assets) has DECREASED over that time. I sleep well with a gigantic cushion between what I could spend and what I do spend.


NICK V from CT posted about 1 month ago:

My question relates to the results presented in the tables. It is unclear if the numbers are calculated in constant dollars. If not, some of the conclusions related to the withdrawal and ending portfolio balances may be misleading. For example for the 25 year period from 1973 to 1997, one dollar in 1973 would be worth less than 30 cents in 1997. At a 4% withdrawal rate, a $1.4M ending balance would be less than $420K in real $. May cause someone to re-think the 4%.


DAVID E from ME posted about 1 month ago:

In 1925, when the average family income was roughly $1,400 per year, a $50,000 retirement income would allow a family to live like royalty in their local community. Naturally, most such families would count it as a grievous misfortune if they were not able to keep up their standard of living and even improve it over the subsequent 25 years, a heavy burden for any investment plan during those particular 25 years. What would interest me in further analysis is the "pain" endured by any of the plans over the various periods. I'm thinking of "pain" as the adjustment a family must make in its standard of living to accommodate its actual real income, assuming they refused to over-withdraw. For example, if inflation is 4% and investment return is 2%, then the pain index is increased by 2. Furthermore, until catch up occurs, the pain continues to accumulate in subsequent years. Years when investment return exceeds inflation need to be discounted, perhaps by raising the expectation floor by one-half the excess return. We make this discounting adjustment because families tend to assume that the good times will continue and adjust their expected standard of living upwardly. The overall result of this accumulating "pain" index would be a measure of the risk of disappointment for each of the allocation plans and withdrawal rates over seventy-five different periods. A low pain index matched by a superior average withdrawal and ending balance would likely be the optimal plan for most times and retirees.


ARNE E from CA posted about 1 month ago:

I'm new to this and have a very basic question - Assuming the portfolio has a balance of $1mm to start. If you withdraw 3% that's only $30K, why does the article say that at 3% in the 80/20 portfolio you'd draw $92? or $74K in the 60/40 one? Sorry if that's a stupid question..


DAVID E from ME posted about 1 month ago:

In answer to Arne E, the portfolios grow and shrink with investment returns. If they grow, then the 3% return the next year is higher and so on. Over 25 years, investment returns can add up even when carrying the burden of management fees and measured withdrawals.


ARNE E from CA posted about 1 month ago:

So the first year you'd only withdraw $30K? Or is the assumption that you would wait until the end of the year before withdrawing - so if the market did well and went up 10% you'd have $1,100,000. then the 3% would be $33K - leaving you $1,067,000. Larger than the original amount. This is disappointing to see that $1mm only generates $30K, that makes retirement further off than I thought.


DAVID L from CA posted about 1 month ago:

I'm single and have no kids, what I leave behind will go to other family, but no one is depending on what I leave. It seems every scenario in the article leaves a decent amount of money, even the ones that ended up with less than what was in the account at the beginning of retirement. Has there ever been a study where you start off with 1MM and at the end of every year you withdraw only the amount that the account produces during that year? You end up with 1MM at death. I want to enjoy my savings not have them grow and not be able to use them. Interesting read "How to Die with Zero" by Bill Perkins talks about the utility of money and how it really drops for a 60 yr old to 90 yr old.


You need to log in as a registered AAII user before commenting.
Create an account

Log In

Get your free copy of our special report analyzing the tech stocks most likely to outperform the market.

Download the FREE Report Here: