


Related

AI-Powered Investing
A website that offers a simple way to compare projected results of various portfolio scenarios.
by Sam Levine | September 2026

Janice recently left her job and is rolling the balance of her $500,000 workplace retirement plan into an individual retirement account (IRA). Though she is happy with her account’s performance, she wants to reevaluate her asset allocation because she’s quite a bit closer to retirement than she was when she originally set up her contributions. Plus, the rollover is being done as cash and thus will need to be invested.
As an AAII member, she’s familiar with the A+ Investor grades for exchange-traded funds (ETFs), mutual funds and stocks. She also regularly looks at AAII’s stock screens and model portfolios. Combined, these have provided Janice with a few ideas that she thinks are both promising and suitable for her goals. Before she puts her money to work, she has one last question to resolve: How much should she put into each investment?
It’s exciting to buy a stock that ends up notching a 300% return, but it won’t make much of a difference in your future lifestyle if that stock represents just 1% of your overall portfolio. Conversely, your lifestyle could be negatively impacted if 30% of your portfolio is in a stock or fund that suffers an abrupt decline, or worse, permanent impairment.
Index funds are a popular way to minimize exposure to individual stock risk. You can find several index funds that hold hundreds of stocks, come with low management fees, and are easy to buy and sell. Plus, extensive information is available about their past.
As easy as it might be to just buy an S&P 500 index fund, a one-fund portfolio won’t be suitable for everyone, nor are investors always fairly rewarded for their volatility. There is also inflation risk, which can lead to underestimating the return necessary to sustain a targeted lifestyle.
Professional advisers routinely use expensive software applications to perform what’s known as a Monte Carlo simulation. The adviser enters data about expected market or asset returns and how much those returns can vary. Then, the application runs repeated trials to forecast potential outcomes. The more variability there is away from an asset’s mean return, the more the results can vary. Monte Carlo programs can also model variable inflation and help investors plan for savings and withdrawals.
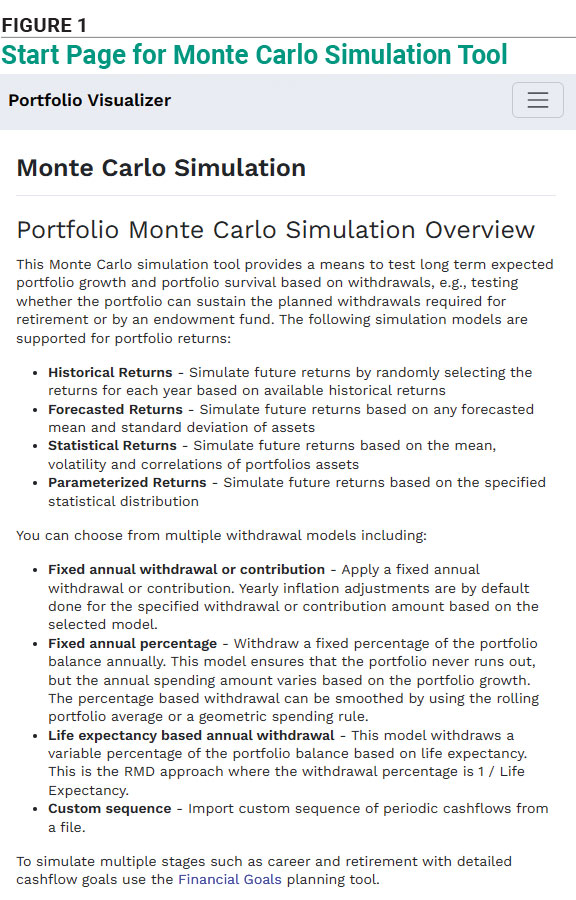
Happily, individual investors don’t need an adviser to run Monte Carlo simulations for them. Portfolio Visualizer is a free/low-cost website that can do this (Figure 1). It has an array of tools that can answer many of the questions that professional financial planners attempt to answer for their clients. It is also straightforward to use and easy to customize, given a few technical terms that I cover here.
Though this article’s main focus is on running Monte Carlo simulations, Portfolio Visualizer offers several other tools that those looking for higher-level portfolio analytics may find useful, including portfolio optimization, factor analyses and correlation analyses.
There are three pricing tiers: free (no log-in required), $30 per month for Basic and $55 per month for Pro. Those who only wish to test a long-term allocation will likely find the free tier to be more than sufficient. Portfolio Visualizer doesn’t have the visual appeal of many polished financial websites, but for a free financial tool, it isn’t overloaded with ads or deceiving buttons that direct to paywalled functionality.
Portfolio Visualizer offers ample documentation about its data and processes, though the terms can be technical and call for additional reading, especially if you don’t use the term “generalized autoregressive conditional heteroskedasticity” at least once per year. (Here’s a tip: Just call it “GARCH” if you want to impress a mathematician at a cocktail party.)
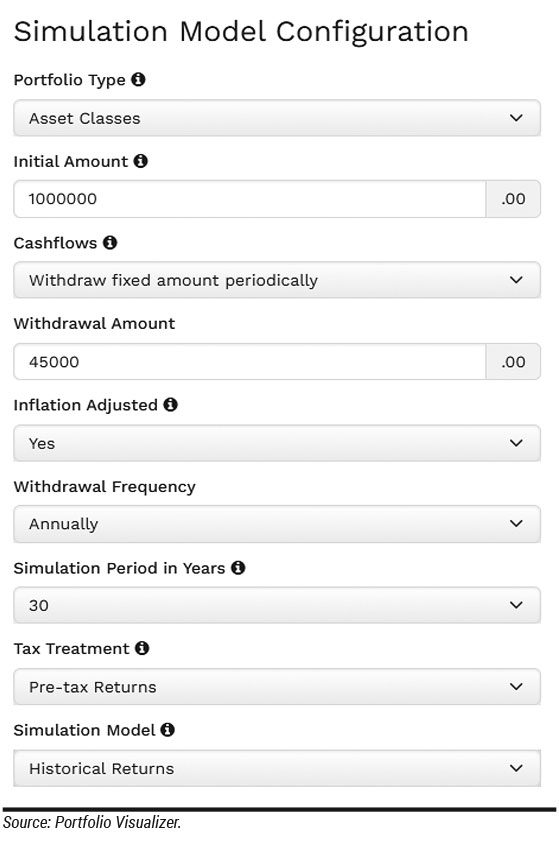
Returning to our opening case study, Janice is considering allocating 60% of her rollover to U.S. stocks and the remaining 40% to bonds. She plans on withdrawing $2,000 per month, which comes out to $24,000 per year. At 4.8% for the first year, that’s a fairly aggressive withdrawal rate. Financial planners currently mention a 3% withdrawal rate as a rule of thumb if the client wants to lower the odds of outliving their savings. Janice also assumes that a blended 20% capital gains and 20% dividend tax rate will continue over her expected 30-year retirement horizon.
She uses asset return data from January 1990 to December 2025. This was the longest time horizon available for the asset classes under consideration. Janice also believes that those 35 years include enough major rallies, sideways markets and market setbacks to lead to valid long-term expectations.
Once Janice has entered her assumptions and pushed the button to start the analysis, Portfolio Visualizer simulates 5,000 potential outcomes based on historical total returns and volatility for U.S. large-cap stocks. It then groups the results by their percentiles within a few seconds. The speed makes it simple to continually tweak the parameters and view the results.
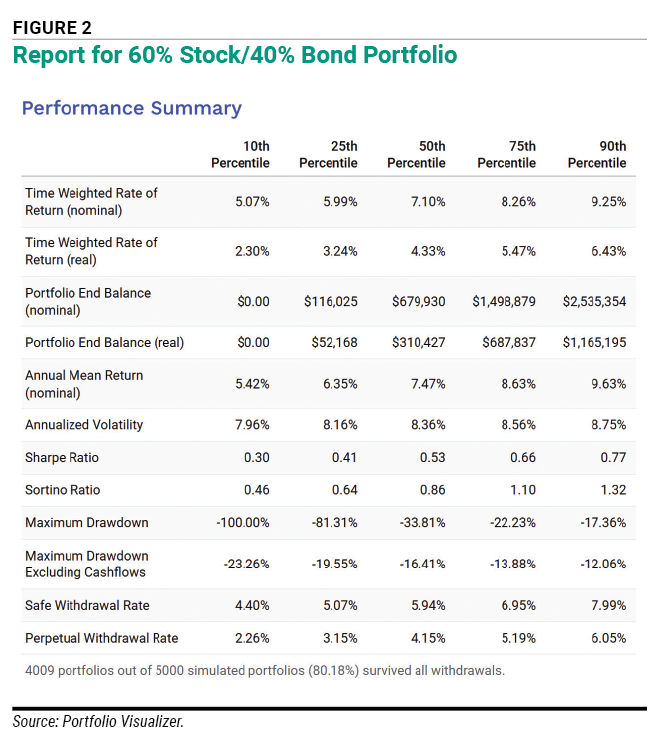
The summary output is shown in Figure 2. Results are in increments ranging from the 10th percentile (worst 10% of all outcomes) to the 90th percentile (best 10%). The extreme ends of the absolute worst and best outcomes are not shown. Those outliers tend not to be helpful for planning.
Janice can also use Portfolio Visualizer to analyze outcomes if the worst-performing periods always came first, allowing her to factor in the impact of a very bad sequence of returns. Considering that the site conducts 5,000 trials, specifying that the worst returns always occur first is very pessimistic. It is most applicable to worst-case analyses.
Noting that there was only an 80.18% chance that her income stream would last the full 30 years, Janice decides to see if she could increase her likelihood of success and possibly retain more principal or be able to increase her withdrawal rate. She maintains the same assumptions as before but uses a blend of 70% U.S. large-cap stocks, 20% U.S. mid-cap stocks and 10% international developed (ex-U.S.) markets.
The new allocation not only increases the portfolio’s odds of surviving Janice’s desired withdrawal rate of $2,000 per month (from 80.18% to 87.48%) but also dramatically increases the forecasts for the ending portfolio values after 30 years. Table 1 shows the difference between the outcome percentiles for a 60% stock/40% bond portfolio and the new allocation.
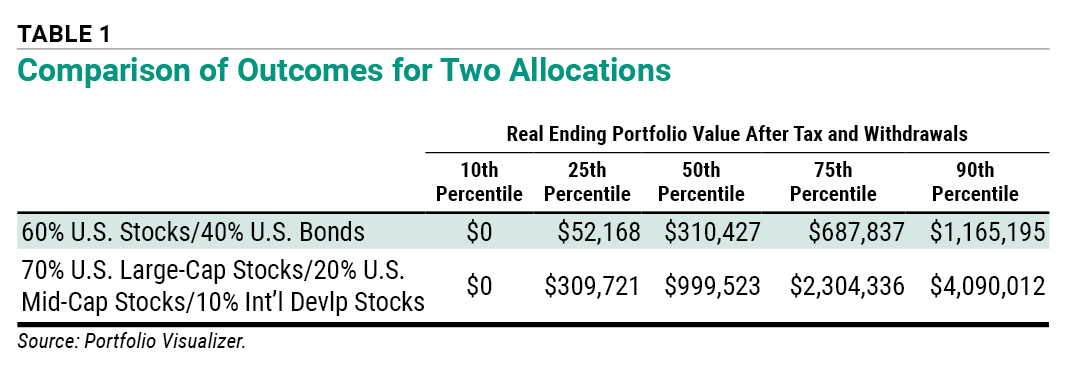
The downside to this change—not shown in the output here due to space constraints—is an increase in the annual volatility. At the 50th percentile, the annualized volatility increases from 8.36% with the 60% stock/40% bond portfolio to 13.02% with the 70% U.S. large-cap stock/20% U.S. mid-cap stock/10% international stock portfolio. Janice will need to decide whether she is willing to accept the year-to-year volatility.
Users aren’t required to choose broad asset classes. Portfolio Visualizer can use stocks and funds in addition to indexes. When analyzing stock portfolios, investors should keep in mind that it’s dubious to use historical data to forecast a stock’s long-term expected return. Today’s Microsoft Corp.  (MSFT) is very different from the one that introduced Windows 1995. Likewise, International Business Machines Corp. (IBM) has changed from relying on sales of mainframe and personal computers to software and consulting solutions. Markets are different in that they are driven by comparatively more stable macroeconomic factors.
By now, you might be excited at the thought of a free/low-cost tool that can help you nail down an asset allocation that can perfectly align your portfolio with the risks you are willing to accept. But there are several issues with Monte Carlo simulations, and with Portfolio Visualizer specifically, that you need to consider before making any important decisions. Some of them can be managed, but some will require you to make judgment calls.
First, the site has some quirky return data sources. Some index return data comes from funds, and some periods contain spliced data from different sources. Though the motivation for using slightly fuzzy data was likely to minimize the developer’s costs, the choices appear to be reasonable. That said, be sure to check the source of the data; the information is provided on the site.
Second, Monte Carlo simulations are based on past data, and the future will always vary from the past. (This applies broadly to any Monte Carlo simulation.) Markets do tend to revert toward their long-term averages but not at any reliably predictable time or rate.
Also, the historical time periods you use for asset returns and volatility have a big impact on the simulation results. Consider what a simulation output might be if the Great Recession or the coronavirus pandemic were excluded because they were thought to be outliers. Inflation assumptions are also subject to that same selection bias. You can get a sense of how much of an effect the period chosen has on your expected return and volatility by running the same simulation over different time periods, ideally not overlapping ones.
You aren’t entirely bound by history, though. One nice feature of Portfolio Visualizer is the ability to enter your own projected asset returns. Do you believe we’re in a productivity and profitability boom era driven by artificial intelligence (AI)? No problem; just pick your expected return and volatility. Or maybe you think that countries will continue to grow their deficits and the next 20 years will have below-average returns. You can simulate that scenario too. Just keep in mind the saying “Garbage in, garbage out.”
Third, some assets and asset classes don’t have enough history to be relied on with confidence. If you want to include an asset class with a shorter history than what you specified as your time horizon, the site won’t run a simulation. For example, price data for real estate investment trusts (REITs) only goes back to 1994. Treasury inflation-protected securities (TIPS) data starts in 2001.
Lastly, you will notice a difference, albeit a relatively small one, in the output when running the exact same simulation using the same data a second and third time. That’s because the average results from one group of 5,000 trials can be slightly different from those of the next set of 5,000 trials.
One of the Monte Carlo simulation’s strengths is its flexibility. One can model an infinite number of scenarios. In Janice’s case, she focused on selecting an asset allocation that would be most likely to sustain her preferred withdrawal rate. She could have also adjusted the withdrawal amount to see how much principal might remain or evaluated the effects of higher or lower inflation.
The tool is also useful for savers. Instead of assuming that every deposit into an investment account would generate the same return, you can produce a more realistic range of potential outcomes and make decisions based on how confident you want to be of the outcome. If you are saving for a critical financial need, you can focus on the conservative outcomes; if you are hoping for a “nice-to-have,” then you might look at the median outcomes.
It can be tempting to seek perfection by spending hours testing different savings or withdrawal rates, combinations of assets, or inflation rates. Doing so ignores the Monte Carlo simulation’s weaknesses. The dataset used to perfect your portfolio might not be valid for the next 10 or 20 years, and, of course, your personal situation will evolve.
Monte Carlo simulation is still far better than simply winging it or uncritically accepting a so-called expert’s advice (though a 60% equity/40% fixed-income allocation isn’t a bad start). Once you understand the tool’s abilities and limitations, Portfolio Visualizer can act as a useful check against excessive optimism or pessimism, both of which can be very costly to investors, particularly over long time horizons. Students of the markets and financial planning will find Monte Carlo simulations fascinating, and they will likely appreciate Portfolio Visualizer’s flexibility as well as its many other free tools.
AI-Powered Investing

Portfolio Strategies


JOHN L from NJ posted about 1 month ago:
SAM L from USA posted about 1 month ago:
ROBERT A from NC posted about 1 month ago:
SAM L from USA posted about 1 month ago:
JOHN L from NJ posted about 1 month ago:
SAM L from USA posted about 1 month ago:
DAVE G from TX posted 26 days ago:
DAVE G from TX posted 26 days ago:
MARK E from IA posted 23 days ago:
SAM L from USA posted 23 days ago:
BARRY J from TX posted 12 days ago:
SAM L from USA posted 12 days ago:
You need to log in as a registered AAII user before commenting.
Log InCreate an account