

Related

Computerized Investing
An allocation to a small-cap value fund can improve both the outcome for a young investor as well as the safe retirement rate for a retiree.

Financial research often confirms familiar truths, but occasionally it surprises us. This article presents the standout surprises I’ve observed over a decade of researching financial return sequences and lifetime investing scenarios for the Merriman Financial Education Foundation.
A renowned industry expert once told me that you can’t say stocks are safer than bonds for the long term, because the risk is the same at the beginning as it is at the end. If you measure risk as the percentage of the account you could lose in a market downturn, or the variability of returns, he’s right. But what if you measure risk as the amount of money you have compared to what you need? The expected growth of an all-stock portfolio with a 10% expected return over 30 years is 17.0 times the starting balance, versus 5.7 times for an all-bond portfolio with a 6% expected return. I think many people would say that stocks are less risky because there’s a greater risk that bonds alone won’t deliver the needed return. It’s not impossible for bonds to outperform over a 30-year time frame, but it’s historically very unlikely.
A key premise of the Merriman Financial Education Foundation’s suggested portfolios is that tilting an all-equity portfolio toward smaller, value-oriented companies—e.g., those that are cheaper on a price-to-book-value (P/B) basis—has delivered higher returns with modest risk increases in the past. One of the first questions we tackled in backtesting was how likely adding a small-cap value (SCV) allocation was to hurt an investor.
The simplest implementation is a 50% S&P 500 index/50% U.S. small-cap value portfolio, which can be easily built using two exchange-traded funds (ETFs) or mutual funds. From 1970 through 2025, this 50% S&P 500/50% U.S. small-cap value portfolio had a 12.5% compound annual growth rate (CAGR), compared to an 11.0% CAGR for the S&P 500 alone. This is a compounded 1.5% per year advantage for tilting.
Standard deviation is a common measure of risk. It describes the variability of returns. For the S&P 500, the standard deviation of annual returns was 16.9%; the 50% S&P 500/50% U.S. small-cap value portfolio was a little higher at 17.8%. So, the tilted portfolio delivered higher returns with a modest increase in risk.
But what does this really mean for investors who don’t invest over 56 years? How often would they have benefited over a 30-year horizon?
To find out, we calculated the returns for portfolios funded with a single lump-sum deposit that started every month over rolling 30-year investing periods. Table 1 shows the results, including the worst 1st percentile, median and best 90th percentile outcomes. For this article, I’ve updated the analysis using Portfolio Visualizer and returns from 1972 through 2025.
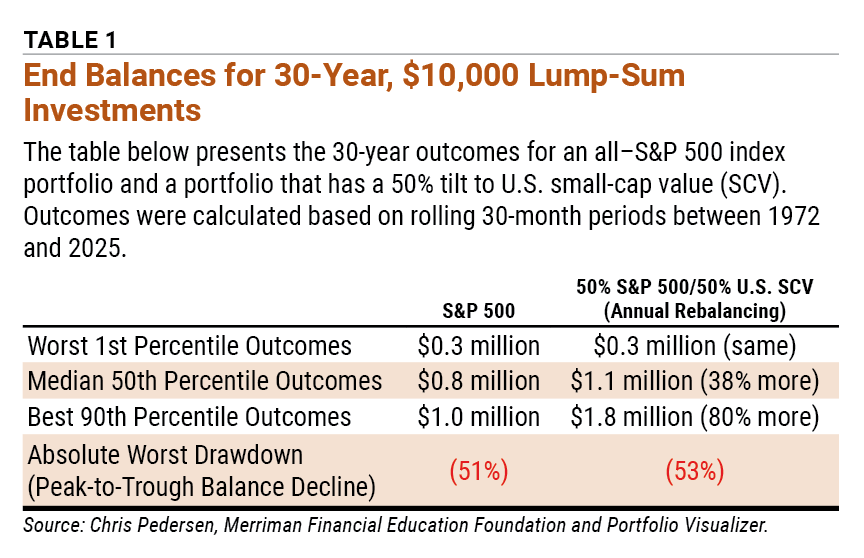
When I first saw the data, I was surprised that the worst-case end balance for the tilted portfolio matched that of the S&P 500 after 30 years. Investors had to tolerate a 53% peak-to-trough decline with the tilted portfolio, instead of a 51% decline for the S&P 500, but the tilted portfolio’s higher returns built a larger balance before downturns hit, so its end balance had a negligible chance of being smaller. The tilted portfolio was riskier throughout the period, but the accumulated gains from higher returns meant that the portfolio’s balance fell from a higher starting point. The net effect is that the tilted portfolio’s end balance had a negligible chance of being smaller than the all–S&P 500 portfolio.
This might seem like getting something for nothing, but it’s not. Although the long-term outcomes are positive, the odds of the 50% S&P 500/50% U.S. small-cap value portfolio outperforming the S&P 500 in the first five years are close to a coin toss. In addition to tolerating a little more volatility, investors in any strategy other than the total market or S&P 500 need to tolerate their returns differing from the large-cap index and resist the temptation to switch strategies when their approach is falling behind.
Thirty years may sound like a long time, but for an early-career investor, it’s only about half of their expected investing lifetime. Because such investors are increasingly using target-date funds as a core investment, we wondered whether adding a small-cap value tilt could help them too.
Target-date funds are designed as one-fund, lifetime investing solutions. They are labeled with an expected retirement year and gradually shift from mostly stocks early in an investor’s career to a more conservative mix, such as 30% stocks/70% bonds, in retirement. The goal is to take more risk when the investor is young and less when they need the money for income.
Surprisingly, many target-date funds include a small allocation to bonds in the early years when an investor has the highest risk capacity. To find out if adding a minor small-cap value allocation might compensate for what we believed to be an overly conservative early asset allocation, we backtested lifetime investing scenarios with and without various small-cap value allocations. This testing included evaluating risk versus age, as well as outcomes assuming steady contributions over 40 years of working and withdrawals over 30 years of retirement. We chose worst-case drawdown (peak-to-trough decline in account balance) as our risk measure because it best reflects the pain an investor would feel when facing losses.
So, did target-date fund allocations do what they said they’d do? Table 2 presents an analysis of historical worst-case drawdowns versus age for the period from 1972 through 2025. The analysis is based on typical target-date fund asset allocations in 2025.
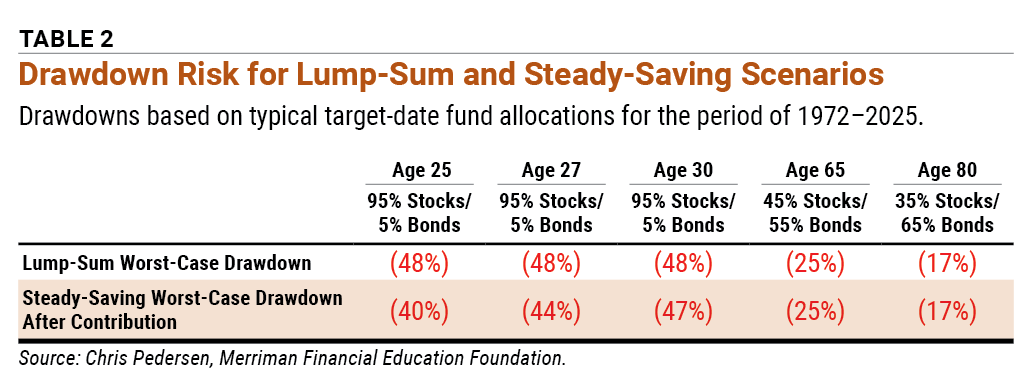
For the lump-sum investor, target-date fund risk starts high and drops with age. The steady saver starting with nothing experiences less volatility when they begin investing than they do five years later. The reason is simple: New contributions mask the impact of market downturns because of the portfolio’s small size.
If young investors were all inheritors with large lump-sum investments, target-date funds would scale risk with age as expected, but most young investors start with little or nothing. For them, the added conservatism of bonds in the early years reduces returns when risk capacity is highest and the need for high returns is greatest.
This raises the question: How much small-cap value would investors in their early 20s need to add to see the same volatility as the target-date fund alone at age 30? The answer is about 60%! So, a young investor is well justified in adding a large allocation to small-cap value in their early years, then ramping it down over time if they want to be more conservative as they near and enter retirement.
Young target-date fund (TDF) investors may want the long-term benefits of a small-cap value (SCV) tilt throughout their investing experience. Historically, if they allocated 10% or 20% of their retirement savings to U.S. small-cap value and rebalanced annually, they would have had, on average, a 10% to 22% larger nest egg entering retirement, assuming a 40-year career of steady saving. To get those returns, they would have had to endure deeper worst-case drawdowns by 4 to 8 percentage points around retirement compared to a typical target-date fund allocation’s –26% worst-case drawdown exposure. I think many investors would decide that the benefits are worth the risk, but some might balk at the difficulty of annual rebalancing. So, what would happen if they didn’t rebalance?
Every situation will be different, but the most likely outcome is that the asset with the higher expected return—small-cap value, in this case—will grow faster and become a greater part of the portfolio than its intended allocation percentage. This outcome, which we see in backtesting, increases returns and risk.
On average over a 40-year accumulation scenario, the 10% U.S. small-cap value allocation grew to 24% and the 20% allocation grew to 41% just before retirement. The impact of the increased risk and reward is best understood using a 40-year investing scenario of $10,000 per year in constant real-dollar—that is, increasing with inflation—contributions. These results are based on historical returns from 1970 through 2025 and Vanguard-like target-date fund asset allocations.
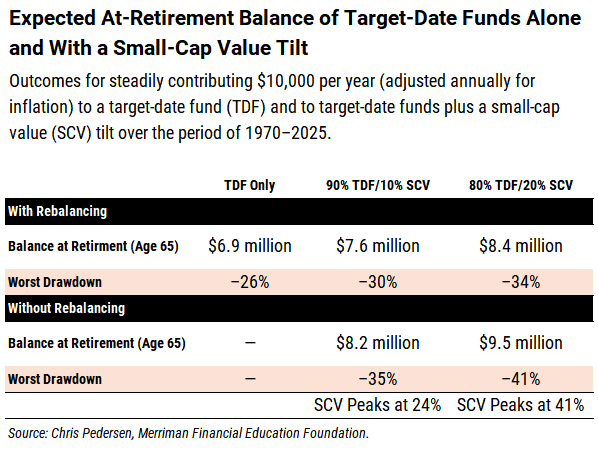
The nominal result for the target-date fund alone is a retirement balance at age 65 of $6.9 million, with a worst-case near-retirement drawdown of –26%. The 90% target-date fund/10% small-cap value approach added $700,000 to the target-date fund–only retirement balance, with a worst-case drawdown of –30%. The 80% target-date fund/20% small-cap value approach added $1.5 million to the target-date fund–only retirement balance, with a worst-case drawdown of –34%. Without rebalancing, the 90% target-date fund/10% small-cap value approach produced nearly the same results as the rebalanced 80% target-date fund/20% small-cap value approach. The unrebalanced 80% target-date fund/20% small-cap value approach produced the highest expected retirement balance of $9.5 million, with the deepest worst-case drawdown of –41%.
One might question entering retirement with such a large allocation to small-cap value, but as I explain below, that may come with unexpected benefits. It’s also worth noting that the retiree’s 4% withdrawals could be used to trim the excess allocation to small-cap value in around three to 12 years.
Since young investors might be drawn to the simplicity and benefits of allocating a fixed amount to small-cap value, what should they do when they retire? Is it crazy to keep that allocation, or could it help?
Retirees generally see risk differently. Return volatility and drawdowns matter, but ensuring that they won’t run out of money is often paramount, especially in the early years of retirement. The metric I find most helpful to people approaching and entering retirement is the safe withdrawal rate.
Popularized by retired financial planner William Bengen, the safe withdrawal rate is traditionally the highest first-year withdrawal percentage, adjusted for inflation each year, that would have lasted 30 years even when starting retirement in the worst historical month.
The safe withdrawal rate depends heavily on a portfolio’s asset allocation. Meaningfully diversified portfolios tend to support higher safe withdrawal rates because they include assets that can do well under different market conditions. Our backtesting of target-date fund asset allocations from 1928 through 2025 demonstrates this. The nearly all-equity allocation of the early years had a 3.7% historical safe withdrawal rate, while the heavy bond allocation (~70%) of the mature retirement allocations (seven or more years after retirement) had a 3.3% safe withdrawal rate. The 50% equities/50% fixed-income portfolio right at retirement had a higher safe withdrawal rate than both, at 3.8%.
When we backtested the impact of adding small-cap value to a retiree’s target-date fund, we found that it improved safe withdrawal rates significantly. Safe withdrawal rates increased from 3.3% for the mature target-date-fund–only allocation to between 4.0% for a 90% target-date fund/10% U.S. small-cap value allocation and 4.9% for a 50% target-date fund/50% small-cap allocation (Table 3).
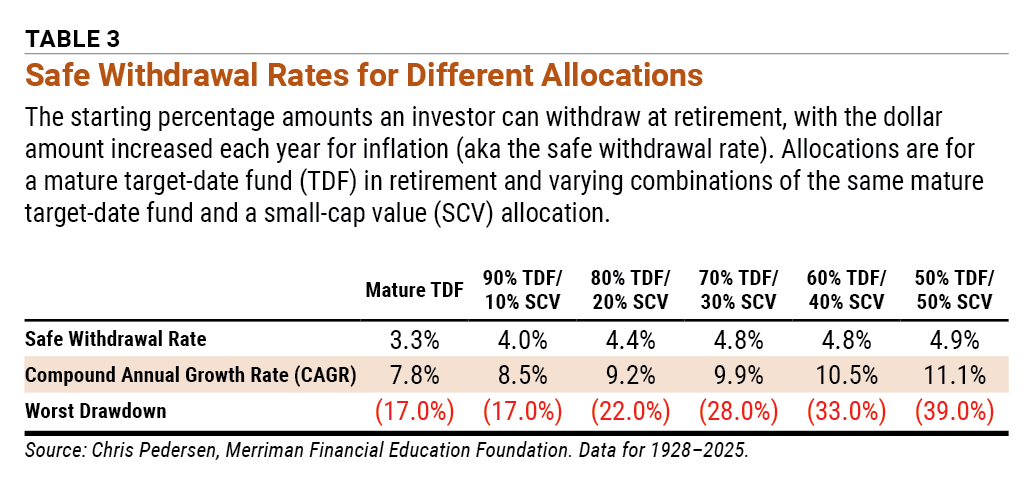
It’s no surprise that expected returns improved while worst-case drawdowns worsened, since we added an allocation to a riskier asset. What is surprising is that the safe withdrawal rate improved, and not just by a little. Even the 0.7 percentage-point jump from 3.3% for the mature target-date fund on its own to 4.0% for the 10% allocation to small-cap value is a meaningful increase in what a retiree could have safely withdrawn.
So, why would adding small-cap value help with safe withdrawal rates here?
Safe withdrawal rates indicate a portfolio’s resilience to sequence-of-returns risk. Portfolios with high safe withdrawal rates are like all-terrain financial vehicles. They can survive a wide range of conditions. When you think about a portfolio made up of a mature target-date fund and a small-cap value fund, you get a mix of many different things. You have equities and fixed income, large and small companies, U.S. and international companies, and value and growth stocks. Each of those attributes thrives in a particular set of market conditions. Together, they’re better than any single one alone.
Since investing is a lifetime endeavor, it’s important to look at the impact that investing choices have over the full accumulation period and through decumulation in retirement. It’s also critical to view the results with the understanding that inflation will take its toll. With that in mind, we sought to understand how investing choices affect investors’ real purchasing power over a lifetime.
Since no two investors will have the same experience, we needed to make some assumptions. We settled on the following scenario: Investors start with $0, work for 40 years, invest the same inflation-adjusted dollar amount on a monthly basis throughout their careers and then retire for 30 years. During the first year of retirement, they take a withdrawal of 4%. The initial withdrawal amount is adjusted for inflation every successive year until the scenario ends after 30 years of retirement.
We ran backtests using this scenario to determine the real expected purchasing power of the investments when they’re spent or inherited, compared to the initial value when they were added to the portfolio. Think of it as an investment purchasing-power multiplier. Table 4 shows the results.
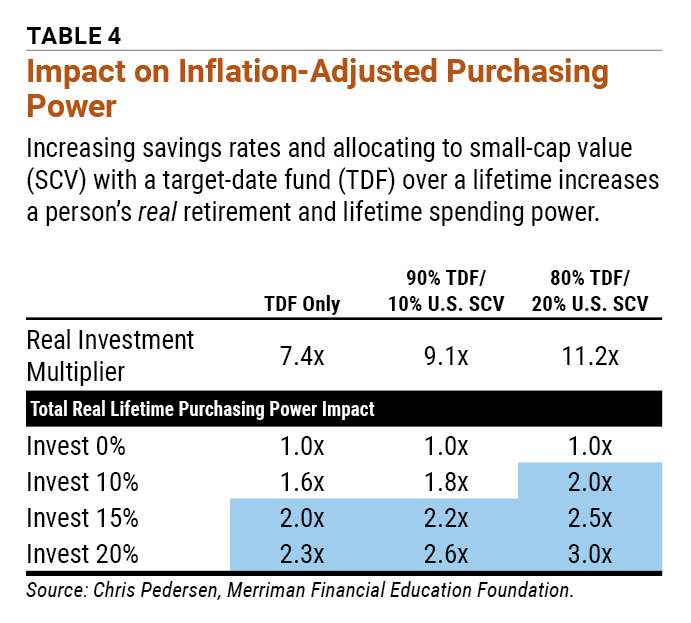
What’s striking is what these multiples mean relative to everything we spend across a lifetime. To keep the numbers simple, let’s say the investor makes a real (inflation-adjusted) average of $100,000 per year across their career. Over 40 years, that’s $4.0 million. At a 10% savings rate, they saved $400,000 and spent $3.6 million during their career ($90,000 × 40). In retirement, the target-date-fund–only investor will have $2.96 million ($400,000 × 7.4) to spend and pass on to their heirs. Given that their retirement is only three-quarters as long as their working years, their lifestyle could be just as rich in retirement as it was in their working years.
The blue boxes in Table 4 are particularly interesting, as they show cases where the investor’s real purchasing power more than doubled over their lifetime. This means the inflation-adjusted purchasing power of the dollars investors spend over a lifetime could be twice what it would be if they hadn’t saved and invested. This is a point I often lead with when talking to young investors. Few know or appreciate that they are likely to build as much real spending power from investments as they do from working. The sooner they understand this, the more likely they are to start saving and investing.
Perhaps our least surprising, but most important, insight is that it doesn’t take many ETFs or mutual funds to build a massive and effectively diversified investment portfolio. Target-date funds like those from Vanguard, Fidelity and BlackRock hold thousands of companies in U.S. and international markets in addition to broadly diversified bonds. These portfolios automatically adjust with age. Small-cap value funds like those from Avantis and Dimensional Fund Advisors also hold hundreds of companies in low-cost ETFs and mutual funds. Combined, they’re an easy path to massively diversified and prudent lifetime investing portfolios.
The main drawback of a two-fund approach is that it hides what’s inside. An investor with 10 funds, or 100 stocks, can easily see which holdings are carrying the portfolio and what the overall asset allocation is; the two-fund investor has to look under the hood. Both approaches have a place, and investors can choose the one that best fits their needs and wants.
Computerized Investing

Mutual Funds


JOHN L from NJ posted about 17 hours ago:
You need to log in as a registered AAII user before commenting.
Log InCreate an account