


All stock investors are faced with the decision of what types of stocks to focus on. Over the years, famous investors have developed strategies that typically encompass one or two overall styles of investing. These styles include but are not limited to value, growth and income strategies.
For this stock screening article, the spotlight is on British financial journalist Algy Hall and his book “Four Ways to Beat the Market” (Harriman House, 2023). Hall began his career in the late 1990s as a financial writer and co-founded Citywire, a website that provides news and insights for professional advisers and investors worldwide. He started tracking stocks and writing about screening strategies in 2011 as part of a weekly column in Investors’ Chronicle magazine after reading “What Works on Wall Street” (Fourth Edition, McGraw Hill, 2011) by famed value investor James P. O’Shaughnessy. Hall was surprised that quantitative screening strategies could be as successful as O’Shaughnessy proved they were. Therefore, Hall set out to research and develop four screens backed by academic and individual research.
Definitions
Beta: A measure of stock volatility or risk compared to a major market index. A stock with a beta of 1.00 is just as volatile as the comparable index.
Enterprise Value: Market capitalization plus debt minus cash and cash equivalents. A comprehensive valuation measure that considers debt and equity.
FTSE Indexes: Financial Times Stock Exchange indexes cover stocks listed on the London Stock Exchange.
Operating Margin: Operating income (earnings before interest and taxes, or EBIT) divided by total sales. A measure of profitability showing the effectiveness of turning sales into profits.
Relative Price Strength: A stock’s price performance relative to a benchmark, such as a major market index.
Return on Equity: Net income divided by shareholder’s equity. A measure of financial performance showing how efficiently a company returns profit to shareholders.
Developing Hall’s Approaches
The four strategies discussed in Hall’s book focus on quality, contrarian value, dividend investing and momentum. He tested the stocks passing his screens and their performance over a 10-year period starting in 2011. Hall wanted to both educate investors and show how the screens have performed over a 10-year period with the passing companies rebalanced annually.
One thing to note is that Hall used the FTSE All-Share index to screen for companies and compares his results to the index’s overall performance. The FTSE indexes are composed of stocks listed in the U.K., but Hall notes that the research behind these strategies applies to international exchanges and especially U.S. stocks. Therefore, AAII’s interpretation of the strategies includes U.S.-listed stocks, American depositary receipts (ADRs) and American depositary shares (ADS) but excludes stocks traded over the counter (OTC). The results of these adaptations mostly held up during our backtesting period that began at the end of 2011. Much like Hall’s performance, the High-Quality Large-Cap screen produced the best average cumulative performance of 331.2% through the end of 2021 (Figure 1). In close second came the Great Expectations (Momentum) Screen with an average cumulative performance of 330.8%. However, the High-Yield Low-Risk screen and the Contrarian Value screen fell short of the S&P 500 index’s return over the period.
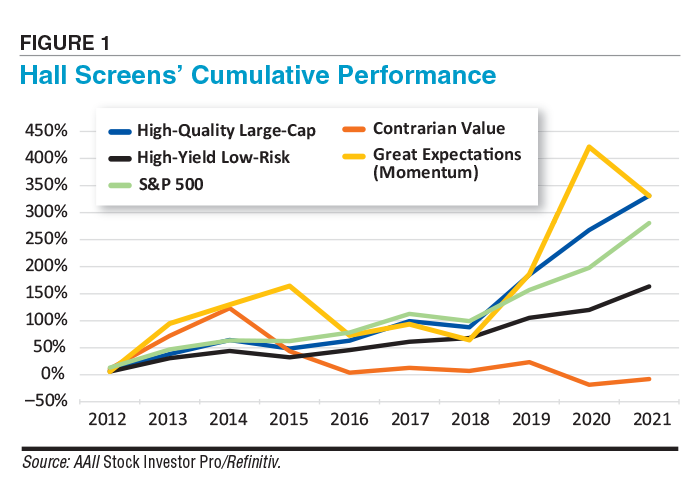
As Figure 1 shows, the performance of each of these strategies is not the same. This makes it possible to diversify by combining Hall’s approaches into a single portfolio.
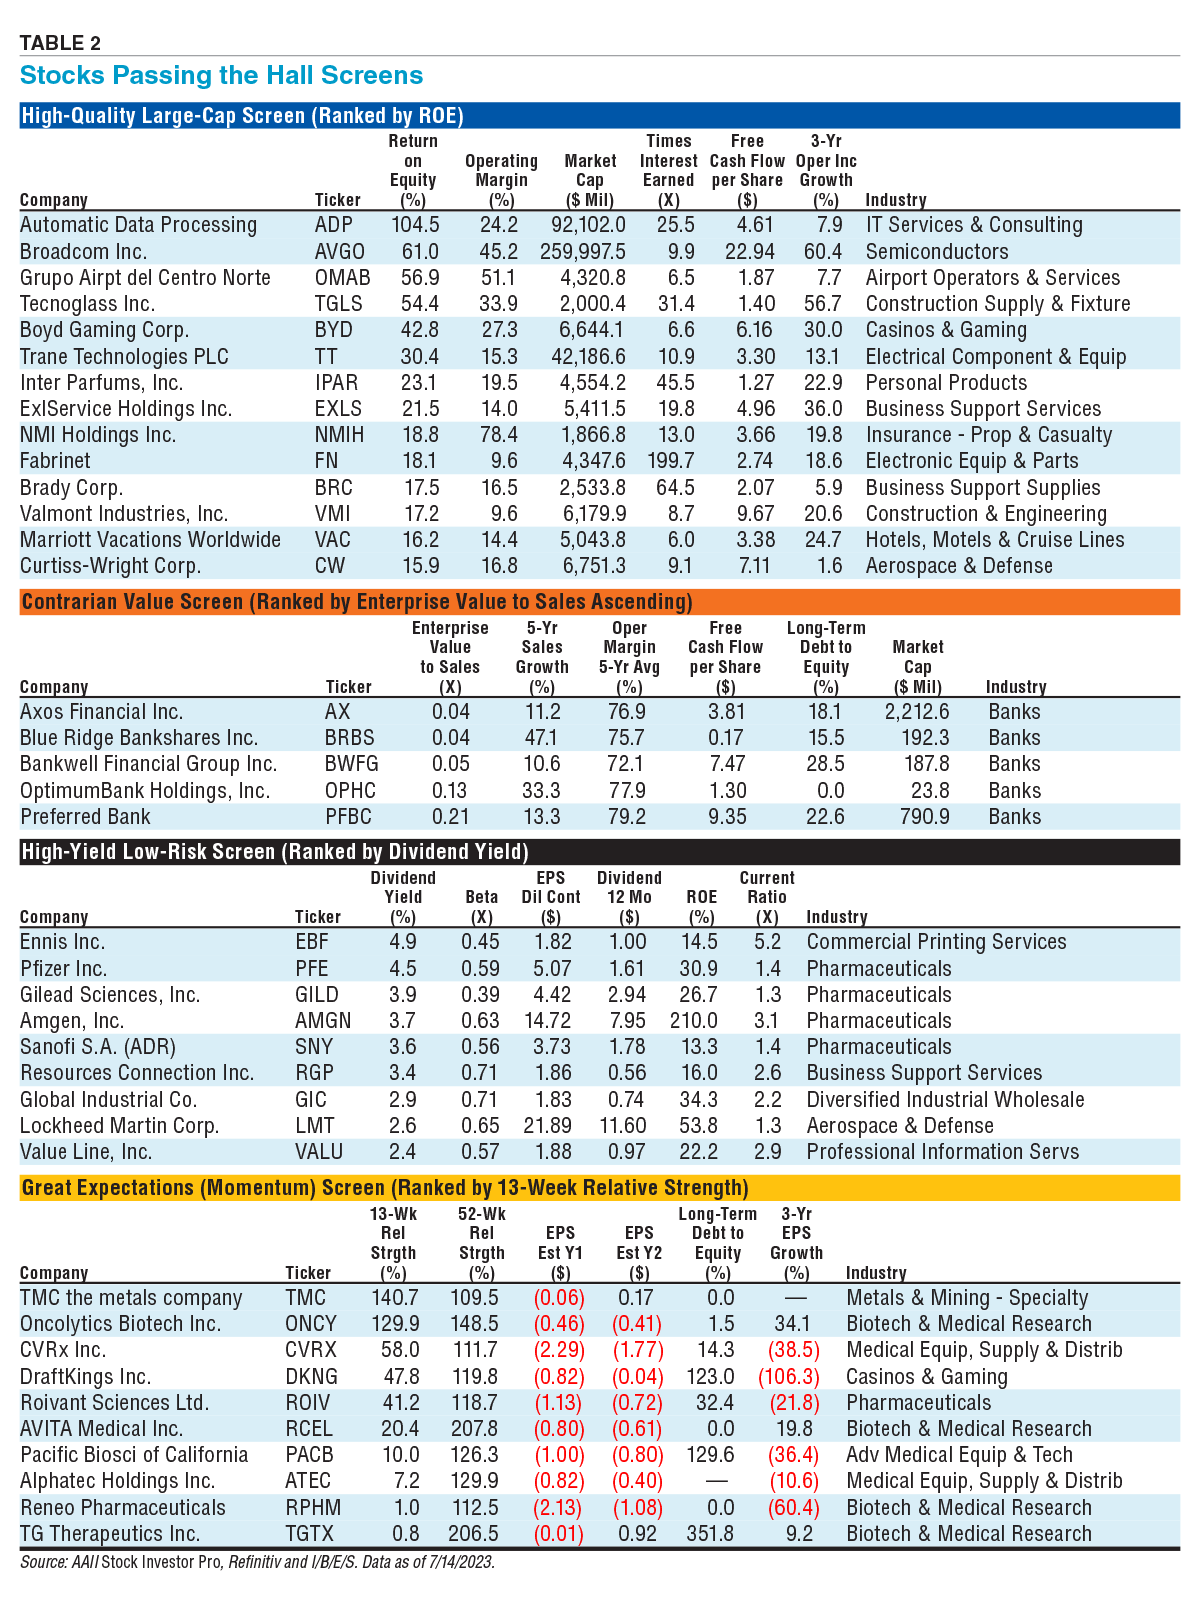
We modified Hall’s screening criteria to fit AAII’s Stock Investor Pro fundamental stock screening and research database. The characteristics of each screen are shown in Table 1. The passing companies for each screen can be seen in Table 2.

High-Quality Large-Cap Screen
Hall’s High-Quality Large-Cap screen favors companies with a high return on equity (ROE) and consistent growth in margins. These companies are positioned to outperform in the long term, and they are likely to endure market downturns. Additionally, quality strategies can perform well when value-based strategies do not, making them a good complement to the latter.
The primary criteria require return on equity and operating margin to be higher than the median for a company’s respective industry. Capital structure tends to vary between sectors and industries, so it’s better to compare a company’s return on equity to its industry average than to the overall market average. Return on equity is a popular measure of profitability and corporate management effectiveness. The simplest method of calculation is to divide earnings for the last four quarters (trailing 12 months) by shareholder’s equity. This relates earnings generated by a company to the investment that shareholders have made and retained within the firm. Shareholder’s equity is equal to the total assets of the firm less the total liabilities of the firm minus preferred stock and redeemable preferred stock. It represents common shareholders’ claim on net assets.
Ideally, as a shareholder, the earnings of the firm are “returned” either through reinvestment into the business or paid out via dividends. Generally, a return on equity of 15% is considered good, and 20% or higher is considered exceptional. However, return on equity can be elevated based on the amount of debt a company has. Too much debt may present a risky situation for a company, so Hall filters for an interest coverage ratio of 5.0 or more to identify companies whose earnings far exceed their interest expense.
Operating margin is calculated by dividing operating income (sales less gross and operating expenses) by total revenue. Generally, operating margin is used to determine how profitable a company is once overhead and marketing costs are factored in. Those with higher margins are selling their products or services efficiently to contribute more to their bottom line. Much like return on equity, operating margins should be compared to industry medians since margins vary across different types of companies. For the quality screen, both return on equity and operating margins should exhibit growth over the past three years and be higher than the industry median.
Hall included secondary criteria such as positive free cash flow, forecasted earnings growth and a market capitalization of at least $1 billion to find companies that are financially stable while exhibiting the fundamentals that pertain to quality. The resulting High-Quality Large-Cap screen shows the best performance of the four strategies in backtesting that rebalanced annually over the 10-year period from the end of 2011 through 2021.
Contrarian Value Screen
Value-based investing is one of the oldest types of stock investing, made popular by famous investors such as Benjamin Graham. The goal is to go against the grain by investing in companies that are cheaply valued by the market but have the potential to outperform in the long term. Over many years, value investing has fallen in and out of favor, especially in recent years as growth companies have taken center stage. However, Hall identifies the lessons to be learned from value investing and explains how they can be applied to all stock investing. Specifically, investing in out-of-favor stocks requires discipline and the avoidance of emotional biases.
Hall presents his Contrarian Value screen with three primary criteria, although we have omitted one because it is not available in Stock Investor Pro: forecasted sales growth over the next two years. We replaced it with growing sales over the previous two years. The two remaining criteria require a five-year average annual sales growth rate of at least 7% and a five-year average operating profit margin of at least 10%. Setting a minimum sales growth rate ensures that potentially undervalued companies have healthy top-line growth. It reduces the possibility of deeply troubled companies ending up on the list.
Hall believes that high operating profit ensures that growth in sales is attributable to efficient use of company resources and lower costs. For value companies, historically high margins mean the company has the potential to return to these levels of profitability in the future. This filter focuses on finding companies with a potential catalyst to drive their stock price higher.
After these conditions are met, Hall uses the enterprise-value-to-sales ratio to find “cheap” stocks. Enterprise value is calculated by adding market cap to debt and then subtracting cash and cash equivalents. (In Stock Investor Pro, we also add in minority shareholder interest and preferred stock.) By comparing enterprise value to sales, investors can get a picture of how valuable a company is in terms of its sales relative to its total market value based on both debt and equity. Other valuation measures such as the price-earnings (P/E) ratio and the price-to-sales (P/S) ratio fail to take debt into account. Hall mentions that the enterprise-value-to-sales ratio looks at the source of the profits rather than the profits themselves.
The screen selects the five stocks with the lowest enterprise-value-to-sales ratios. Though the screen does not have an industry bias, all five of the stocks are banks. This is because the banks industry group currently has both high operating margins and low valuations.
Screening Criteria
High-Quality Large-Cap Screen
- Return on equity (ROE) higher than industry median
- Operating margin higher than industry median
- ROE and operating margin growth over the last three years
- ROE and operating margin higher than industry median over the last three years
- Times interest earned ratio of 5.0 or more
- Positive free cash flow per share
- Operating income growth over the past three years
- Forecasted earnings growth for each of the next two years
- Market capitalization of at least $1 billion
Contrarian Value Screen
- Five-year average sales growth rate of at least 7%
- Five-year average operating margin of at least 10%
- Increasing sales over past two years
- Positive free cash flow per share
- Long-term debt to equity less than 50%
- Select five stocks with lowest positive enterprise-value-to-sales ratios
High-Yield Low-Risk Screen
- Dividend yield higher than median for S&P 500 index’s dividend-paying stocks
- Beta of 0.75 or less
- Dividends covered 1.5 times or more by earnings
- Seven years of unbroken dividends and positive earnings
- Dividends and earnings higher than five years ago
- ROE of 12.5% or higher
- Current ratio of at least 1.0
Great Expectations (Momentum) Screen
- Price momentum better than the index over the past three months
- Price return at least double that of the index over the last year
- Earnings estimates for next two fiscal years revised upward at least 10% in the past three months
- Forecasted earnings growth over next two fiscal years at least 10% per year
- At least two analysts providing estimates for next two fiscal years
High-Yield Low-Risk Screen
Dividend investing is a popular strategy among many investors as it provides a steady stream of income alongside possible capital gains. Hall presents his interpretation of a high-yield, low-risk screen to find companies that are reliable, less volatile and have a history of paying consistent dividends. He found that companies with a history of paying their shareholders perform well over the long term. Hall notes that this screen is another type of quality screen, though it is different than the High-Quality Large-Cap screen.
The primary criteria for the High-Yield Low-Risk screen are a dividend yield above the market median for dividend payers and a beta of 0.75 or less. For AAII’s interpretation of the screen, we used the median yield for all dividend-paying stocks in the S&P 500 as the market median, which was 2.3% as of July 14. Beta is a measure of volatility that compares a stock’s historical volatility to a major market index (in this case, the S&P 500). A stock with a beta of 1.00 has an equivalent level of volatility to that of the market. Requiring a beta of 0.75 or less identifies stocks that have incurred relatively smaller price swings than the market and are thus less risky from the standpoint of price volatility.
The secondary criteria require companies to have a long history of paying dividends and the ability to continue paying them. Hall suggests looking for 10 consecutive years of continuous dividend payments and positive earnings per share, but the look-back period in Stock Investor Pro limits us to seven years. Additionally, dividends and earnings per share must be higher than they were five years ago. In order to find companies that can cover their dividend payments with earnings, companies must have earnings per share that are at least 1.5 times higher than the dividend payment per share. Companies with healthy bottom lines are better able to continue returning cash to shareholders.
The final secondary criteria require a return on equity of at least 12.5% and a current ratio of 1.0 or higher. As discussed with the High-Quality Large-Cap screen, a higher return on equity indicates greater profitability and management that is effectively generating earnings from shareholder’s equity. The current ratio is utilized to measure liquidity. Calculated as current assets divided by current liabilities, a current ratio above 1.0 shows that a company can cover its short-term obligations with cash on hand or highly liquid assets. These companies are less likely to cut their dividends since they have the liquidity to pay off any liabilities shorter than one year and would not need to allocate additional resources.
Great Expectations (Momentum) Screen
The fourth and final screen presented in Hall’s book is the Great Expectations (Momentum) screen. Its name is fitting since the screen’s passing stocks are outperforming in terms of price return, a sign of high expectations from investors about the prospects for future outperformance. At its core, this screen is a momentum strategy that utilizes increasing prices and earnings per share. Rather than looking at stock fundamentals for a specific type of company, the Great Expectations screen looks for companies currently in an upswing that have been so for a long period.
The primary screening criteria include consideration for relative strength and earnings estimate revisions. Relative price strength compares a stock’s price performance relative to a benchmark, such as a major market index. Stock Investor Pro uses the S&P 500 as the benchmark for calculating relative strength. In simple terms, a stock exhibiting strong momentum is realizing a higher return than the market over a specified period. Hall suggests looking at stocks with strong momentum over the past three months.
Seeking positive earnings estimate revisions identifies companies followed by analysts who are raising their earnings forecasts. Hall suggests screening for companies with upward earnings estimate revisions for the next two fiscal years of at least 10% over the past 12 months. Stock Investor Pro tracks estimate revisions for periods of up to the past three months, so we screen based on three-month estimate revisions instead. Hall was wary of companies with very few analysts providing estimates. To account for this but avoid making the screen overly restrictive, we require passing companies to have at least two analysts providing estimates for each of the next two fiscal years.
Secondary criteria added to the screen narrow down the list of passing companies much further since the initial three filters can be very broad. Hall explains that it is important to look at price momentum for longer periods of time to eliminate stocks with a fleeting, short-term trend. Therefore, 12-month relative price strength should be at least twice as strong as three-month relative strength. Our interpretation of the screen requires a positive 13-week relative strength plus a 52-week relative strength of at least double the S&P 500. Earnings estimates should forecast growth of at least 10% over each of the next two years. Earnings growth helps to support further increases in a stock’s price.
Hall mentions three broad categories that Great Expectations stocks typically fall into: structural growth, cyclical growth and turnarounds. Structural growth companies reside in industries that are young and growing. Cyclical growth companies are subject to economic and business cycles; price momentum helps to identify when the cycle is in the investor’s favor. Lastly, turnaround companies are characterized by the implementation of new strategies or management teams. Turnaround companies identified by the screen already have systematic changes in place to capture their long-term growth prospects. However, investors should be wary of high debt and aggressive accounting measures some of these companies tend to have.

Related

Related

AAII How-To
The Benefits of Combining Value & Momentum
Discussion
FREE REPORT

Get your free copy of our special
report analyzing the tech stocks
most likely to outperform the
market.
JOHN L from NJ posted over 3 years ago:
You need to log in as a registered AAII user before commenting.
Log InCreate an account