


Related

Tax Strategies
Some mutual funds and ETFs distribute potential tax headaches along with income to shareholders, while others are more tax efficient.

When selecting mutual funds and exchange-traded funds (ETFs), investors are likely to focus on investment objective, strategy, performance, fees and how the investment fits into an existing portfolio. We might not think about the tax aspect of our investment until a distribution is announced or we are preparing our tax returns—especially if a distribution is larger than anticipated.
In this article, we use high-yielding mutual funds and ETFs to demonstrate how tax-cost ratios can vary. Some mutual funds and ETFs distribute potential tax headaches along with income to shareholders, while others are more tax efficient.
Mutual funds, in particular, are known for generating embedded gains—gains from selling securities that have yet to be distributed to fund shareholders. When a new investor purchases shares in a fund with embedded gains, they are reflected in the funds’ net asset value.
When investors sell their fund shares, the mutual fund may liquidate underlying investments to raise cash for meeting those redemptions. Additionally, funds often sell holdings near reporting periods to reposition the portfolio. These sales can happen when the fund is experiencing good (up) or bad (down) performance; either way, they affect investors who continue to hold their shares in the fund by the distribution of gains or the taking of losses.
Many index funds that track more widely followed indexes tend to experience lower turnover within their portfolios, which in turn helps control embedded capital gains. However, indexes can change, and components may be removed or added, causing selling activity in the fund.
The tax consequences of fund distributions for shareholders will depend on the underlying assets sold. If a fund sells shares in a stock that have appreciated, shareholders will incur a per-share gain proportional to the overall appreciation of the fund’s net asset value (NAV).
Applicable tax rates depend upon how long the security was held by the mutual fund. Investments held by the fund longer than one year would result in long-term capital gains when sold, and thus the distributions would be taxed at the favorable rate between 0% and 20% depending on the shareholder’s tax bracket—plus the additional 3.8% net investment income (NII) tax, if applicable. Investments held by the fund for less than one year would result in short-term capital gains; the shareholder would pay tax on these gains at their ordinary income tax rate, plus potentially the NII levy. State taxation varies.
Fund distributions can include both capital gains and portfolio income. Note that capital gains (and dividend) taxes only apply to taxable accounts and not tax-preferred accounts like traditional and Roth individual retirement accounts (IRAs), 401(k)s or 403(b)s.
The fund itself generally does not pay federal income tax on gains distributed to investors.
ETFs are typically tax efficient because of their ability to exchange securities “in kind” using the creation/redemption process. However, they are not tax-free, as they may engage in taxable transactions by buying and selling securities when their underlying or tracking index is rebalanced and securities are removed or added.
Like an expense ratio, the tax-cost ratio is a measure of how one factor can negatively impact a fund’s performance. Funds with no taxable distributions will have a tax-cost ratio of 0% and those with higher ratios are less tax efficient. The tax-cost ratio is based on aftertax returns—it is based on the same assumptions as those returns, and it is an estimate of what a hypothetical investor holding such funds in a taxable account would experience.
For example, the tax-cost ratio assumes that investors pay the maximum federal tax rate on capital gains and ordinary income. For investors in lower tax brackets, the effect of the stated tax-cost ratio will be diminished.
Given AAII members’ interest in income-producing investments and the desire to minimize taxes, we are highlighting yield and tax-cost ratio together. The tables here show high-yielding mutual funds and ETFs with lower tax-cost ratios, along with high-yielding mutual funds and ETFs with higher tax-cost ratios.
We limited the universe to large blend and large value mutual funds and ETFs. These are the funds most likely to hold domestic dividend-paying stocks. Plus, these funds tend to be less risky than funds targeting smaller companies and are therefore of greater interest to income-seeking investors.
We use Morningstar’s mutual fund and ETF data. The tax-cost ratio measures how much a fund’s annualized return is reduced by taxes investors pay on distributions. The tax-cost ratio provides additional information that is not available from reviewing aftertax returns alone.
Yield is calculated as income for the most recent 12 months divided by the month-end NAV. The yield metric is useful for investors seeking income, and we use it to compare the funds within the tables. Of course, higher yields are preferred by income-seeking investors. We required all funds to yield at least 1.5%, which is the median for large blend and large value domestic ETFs. For reference, the S&P 500 index yielded 1.6% for the month of August.
Performance is included in the tables as an obvious metric that investors consider and track. Those who follow this column each month are likely familiar with our presentation of the returns and corresponding AAII A+ Investor Grades.
The tables also show the category risk index. This measure compares the standard deviation of returns for individual funds with that of peers from the same category and is based on monthly returns for the past three years. The average value is 1.00. Funds with a higher value have experienced more volatile returns than their peers, while funds with a lower value have experienced less relative volatility.
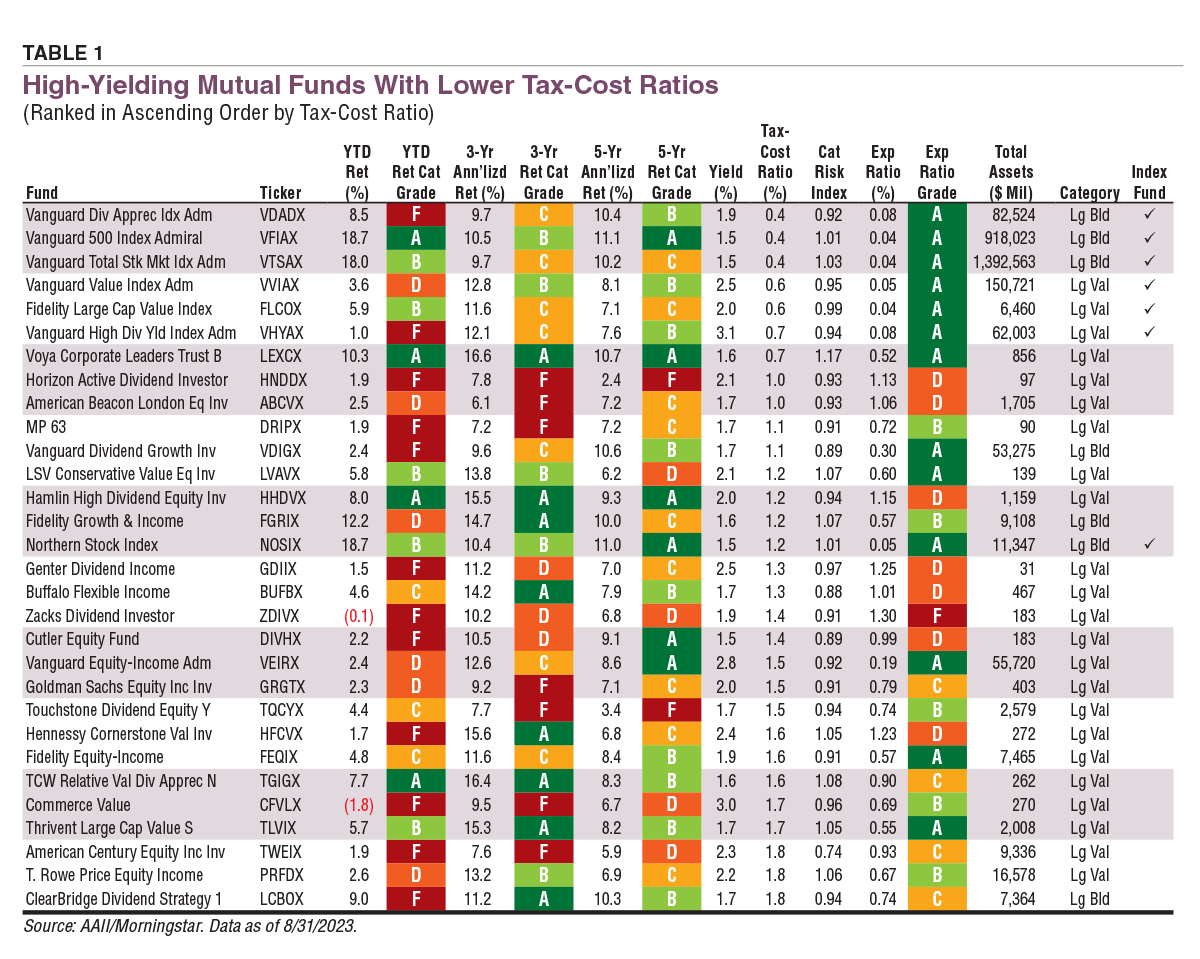
Vanguard has a reputation for providing high-quality investment options while keeping a lid on expenses. In Table 1, four of the top five high-yielding mutual funds with the lowest tax-cost and expense ratios are Vanguard funds. The Vanguard Dividend Appreciation Index Admiral fund  (VDADX) took the top spot with a tax-cost ratio of 0.4%, a yield of 1.9% and an expense ratio of 0.08%. The tax-cost ratio implies that an investor in the highest tax bracket lost just 0.4% of their return to taxes.
All Vanguard funds in Table 1 earned an A+ Investor Grade of A for their expense ratios. The other three funds in the top four are the Vanguard 500 Index Admiral fund (VFIAX), the Vanguard Total Stock Market Index Admiral fund (VTSAX) and the Vanguard Value Index Admiral fund (VVIAX). Notably, these are all passively managed index funds. They are also among the top 10 most widely held mutual funds by assets under management (AUM).
Download the Excel spreadsheet for Table 1.
The average yield for the funds in Table 1 is 2.0%. One of the least tax-efficient funds in this table is the T. Rowe Price Equity Income fund (PRFDX). It is an actively managed fund with a yield of 2.2% and a tax-cost ratio of 1.8%. The fund’s distribution history can be found on T. Rowe Price’s website. Capital gains distributions equated to approximately 7% of the fund’s reinvestment price in 2021 and 4% of the reinvestment price in 2022. The fund earned an A+ Investor Grade of B for an expense ratio of 0.67%.
The Voya Corporate Leaders Trust Series B fund (LEXCX) gets the best overall report card in the table. It earned A’s across the board for returns and expense ratio. The yield is 1.6%, and the tax-cost ratio is 0.7%. (Distributions, which are listed in the prospectus, equated to less than 2% of end-of-year NAV in 2022.) However, its category risk index of 1.17 is higher than the average for all large value funds.
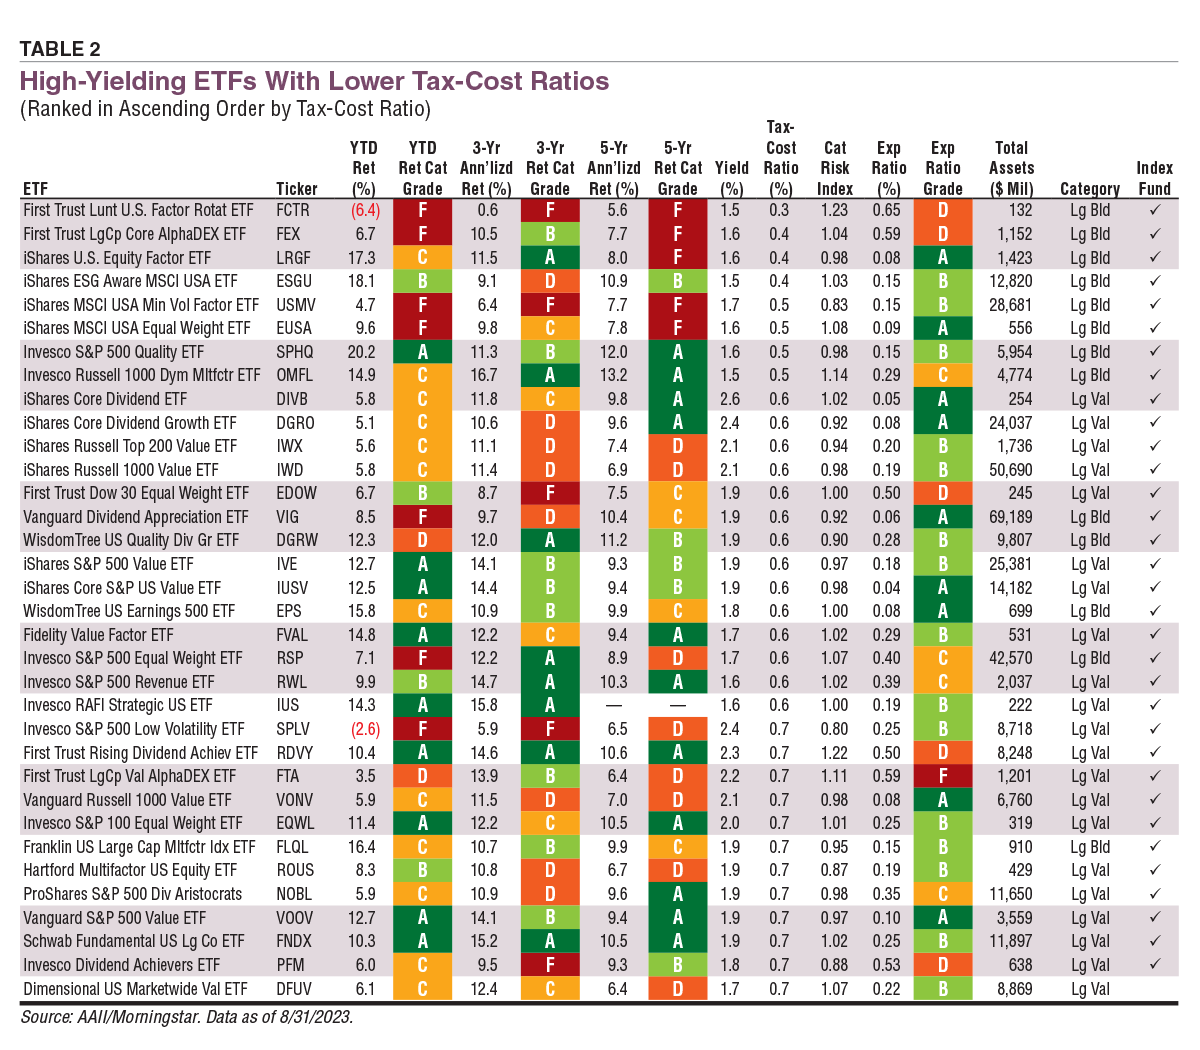
The First Trust Lunt U.S. Factor Rotation ETF (FCTR) is in the top spot in Table 2, which depicts high-yielding ETFs with lower tax-cost ratios. It checks the box for minimum yield, 1.5%, and has the table’s lowest tax-cost ratio of 0.3%. However, it earned an A+ Investor Grade of D for an expense ratio of 0.65% and is likely in hot water with investors for the F’s it earned across all three return periods.
Download the Excel spreadsheet for Table 2.
The Vanguard Dividend Appreciation ETF (VIG) has a yield of 1.9% and a tax-cost ratio of 0.6%. This is slightly higher than the aforementioned mutual fund version of this ETF. Distributions in 2022 appear to have been slightly higher for the ETF. We point this out as an example of how ETFs aren’t always more tax efficient. Given that the fund and ETF have the same yield and similar expense ratios and A+ Investor Grades, interested investors should choose the share class they are most comfortable owning, especially since the tax-cost ratios are so close.
The iShares Core Dividend ETF (DIVB) has the highest yield in Table 2 at 2.6%. Its tax-cost ratio of 0.6% is in line with the median value for the table.
The First Trust Rising Dividend Achievers ETF (RDVY) was the performance star of the group with A grades for all three return periods. The yield of 2.3% and the tax-cost ratio of 0.7% are also good. The expense ratio of 0.50%, which earned it an A+ Investor Grade of D, and above-average category risk index of 1.22 dulls some of its shine, however.
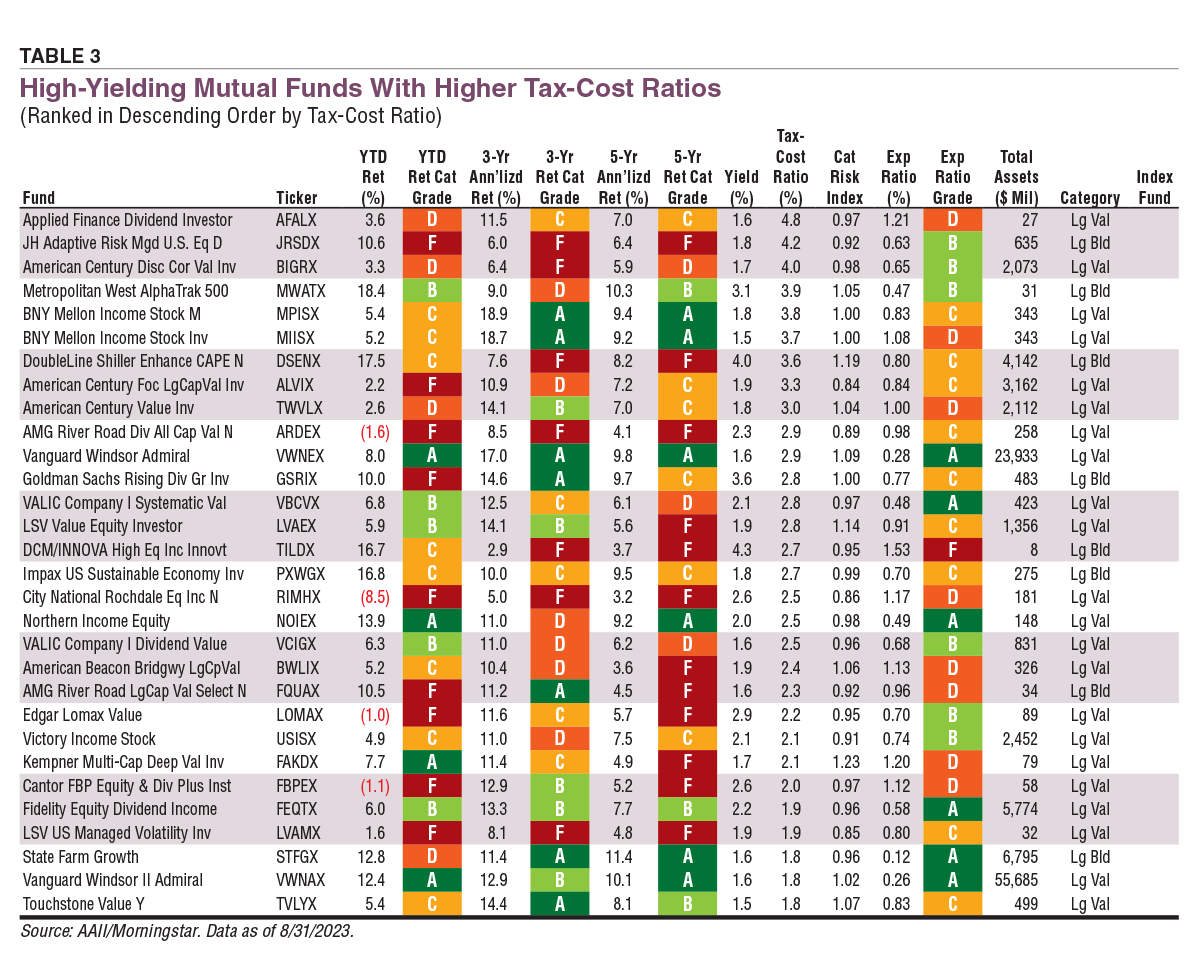
Table 3 shows the high-yielding mutual funds that have higher tax-cost ratios. The actively managed Applied Finance Dividend Investor fund (AFALX) has the highest tax-cost ratio of 4.8%. The fund made a proportionately large distribution in 2021, reflecting the realization of long-term capital gains. This $5.76 per share distribution was relative to the NAV of $11.79 per share, according to Morningstar data. Last year, Applied Finance Dividend Investor made a $1.48 per share distribution on NAV of $9.58 per share. These numbers show how a tax-cost ratio’s three-year period is impacted by individual-year distributions as well as the tax liabilities that capital gains can cause. Also noteworthy is the fund’s expense ratio of 1.21%, an A+ Investor Grade of D.
Download the Excel spreadsheet for Table 3.
The DCM/INNOVA High Equity Income Innovation fund (TILDX) has the highest yield at 4.3%, along with the highest expense ratio at 1.53%. This elevated expense ratio earned the fund an A+ Investor Grade of F. The fund’s tax-cost ratio is 2.7%.
The Kempner Multi-Cap Deep Value Investor fund (FAKDX) has the highest category risk index of all mutual funds in Table 3 at 1.23. The fund’s yield, tax-cost ratio and expense ratio are 1.7%, 2.1% and 1.20%, respectively. Although not the highest expense ratio in the table, it earned an A+ Investor Grade of D.
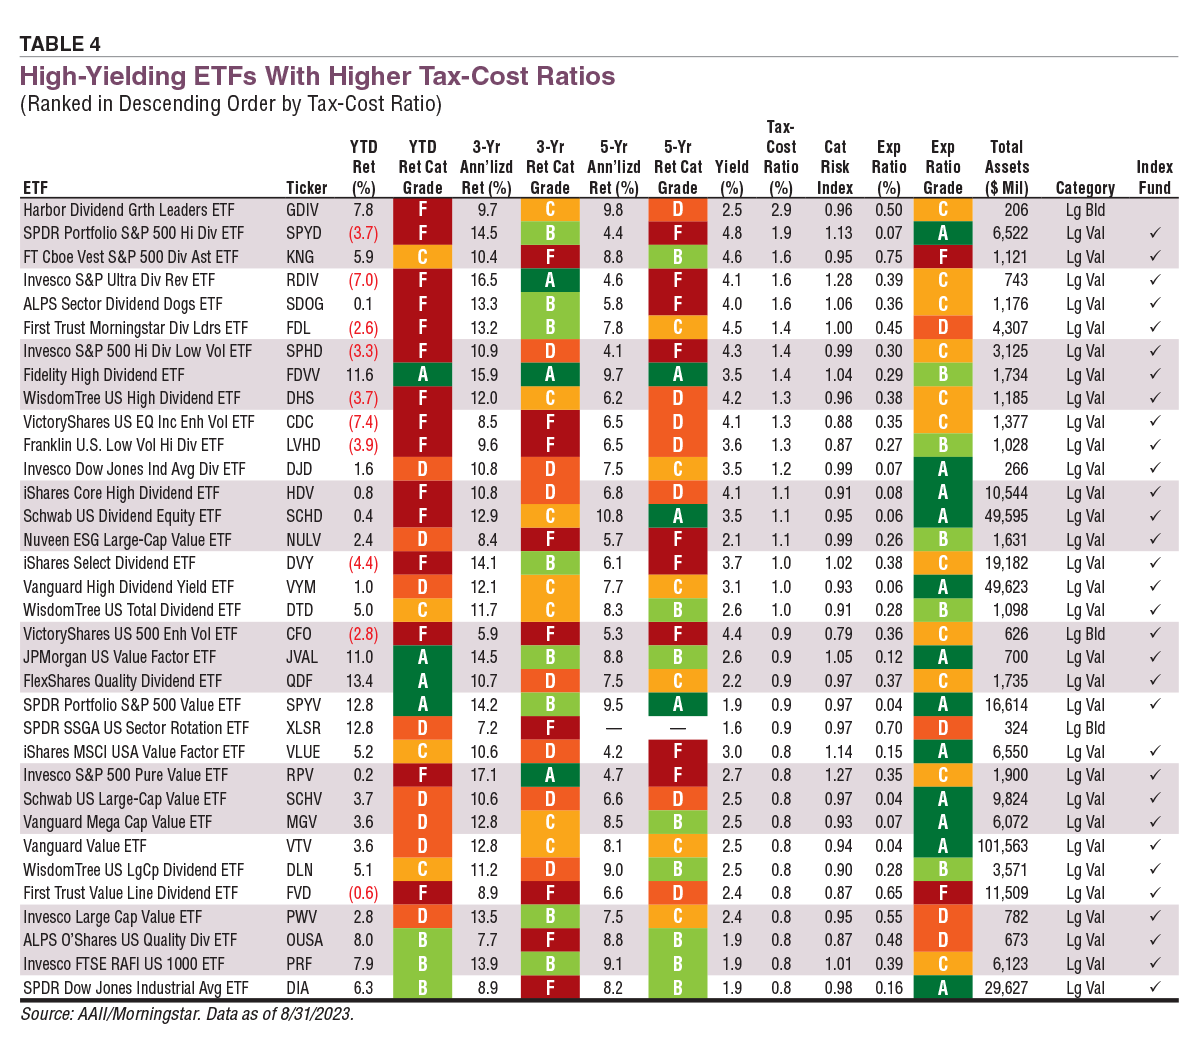
The Harbor Dividend Growth Leaders ETF (GDIV) has the highest tax-cost ratio of all ETFs depicted in Table 4. Its tax-cost ratio is 2.9%. The ETF distributed $2.95 per share last year in net realized capital gains plus $0.18 per share in dividends from NII. Harbor Dividend Growth had a NAV of $12.34 per share at the end of last year. These numbers show how even ETFs can be tax inefficient.
Download the Excel spreadsheet for Table 4.
The SPDR Portfolio S&P 500 High Dividend ETF (SPYD) had the next highest tax-cost ratio at 1.9%. This ETF also boasts the highest yield in the table at 4.8%. Its year-to-date and five-year returns are shaky, as can be observed by the A+ Investor Grades of F for those periods. For the three-year period, its return earned a B. In terms of grades, the Fidelity High Dividend ETF (FDVV) earned A’s across all three return periods. The tax-cost ratio is 1.4%, with distributions made quarterly. The fund has a 3.5% yield and an expense ratio of 0.29%, which earned a grade of B.
Higher tax-cost ratios are a drag on realized returns in taxable accounts. Just like expense ratios reduce pretax returns, tax-cost ratios reduce aftertax returns.
Investors can look at the fund’s website and prospectus to see distributions over time and ascertain trends. The tax-cost ratio can be used to compare mutual funds and ETFs; it is listed in our comprehensive guides on AAII.com and in individual fund Evaluator pages. The tax-cost ratio can be helpful as a tie breaker when returns, expense ratios or other portfolio characteristics of two funds are similar. Finally, remember that this ratio is not forward looking, and it is important to consider a fund’s strategy and performance record before investing.
Tax Strategies

AAII How-To


ROBERT A from NC posted over 2 years ago:
HARRY M from PA posted over 2 years ago:
Cynthia M from IL posted over 2 years ago:
HARRY M from PA posted over 2 years ago:
RICHARD V from CA posted over 2 years ago:
You need to log in as a registered AAII user before commenting.
Log InCreate an account