


The question every investor wants to know is: How well am I doing? Although some people are satisfied simply watching the dollars grow, most investors want that translated into a performance figure.
Bragging rights aside, there is good reason to determine your own portfolio’s performance: Measuring the performance of your total portfolio is useful to see if the long-term terminal value that you hope to achieve with your investment program is realistic.
What Is Portfolio Return?
Every investor has financial goals, both short- and long-term, that they aim to achieve. When we talk about portfolio return, we are referring to how much an investment portfolio gains or loses in a specific period. These gains or losses apply to the total assets within that specific portfolio. That’s important to note because many investors often have several types of portfolios among their investments, with different goals and risk tolerance in mind. An overall goal across several portfolios is to reach a balanced return on investment over time as well as in bullish and bearish market environments.
Why Is It Important to Calculate Your Portfolio’s Return?
In general, you should be examining the return on your portfolio to make sure it is within the target range you expected, based on the investment mix you have settled upon. If it isn’t, you may need to make some adjustments, switching out of underperforming (relative to peers) segments of your portfolio, or you may need to make changes in your future projections—for instance, you may have to increase your savings rate, you may have to take on more risk to achieve the target that you set, or you may simply have to adjust your target value downward, settling for less in the future.
A “best practice” that investors can follow is to review their portfolios at the same time each year and adjust to continue meeting their financial goals. These adjustments may include revising their allocation based on their current risk tolerance, management preferences, portfolio diversification needs and new targets.
Methods for Calculating Your Portfolio’s Return
There are two ways you can calculate the return of your portfolio; both are illustrated in Table 1, which provides an example of the calculations.
Portfolio Method #1: The Sum of the Parts
The first method is a sum of the individual parts: First, the return for each holding is multiplied by the percentage of the total portfolio market value that the holding represented at the beginning of the period; these “weighted” returns are then added together for the total portfolio return.
The information needed for this calculation method is relatively easy to obtain—if you are monitoring the individual holdings in your portfolio (as you should be), this information should be right at your fingertips.
The market values for your holdings at the beginning and end of the period are on mutual fund and brokerage account statements.
For the returns of mutual fund holdings, you can use one of the many websites that provide information on mutual fund performance, including AAII.com. If you are investing in stocks on your own, you can use the equations shown in the accompanying box for your own stock portfolio return, using the beginning and ending market values for the period on your brokerage account statements. The approximation equation (described more fully in the next section) should be used if you have made additions or withdrawals to your stock portfolio. If you have not made additions or withdrawals, the return equation is your actual return rather than an approximation. Of course, investment software and websites are available that can perform precise calculations.
Table 1 illustrates the sum-of-the-parts calculation. The first part of the table presents a listing of this investor’s total portfolio holdings during the first quarter. The market value of each holding at the start and end of the period is indicated, along with the percentage of the total portfolio that each holding represents.

The period return column indicates the return over the time period for each portfolio. For the mutual fund holdings, the returns indicated in the table are simply examples. For the individual stock portfolio, the return was calculated using the approximation method because of the net addition to the stock portfolio.
How to Calculate Portfolio Method #1
The equation labeled Return Calculation #1 shows how the portfolio return was determined:
- For each holding, the portfolio percentages at the beginning of the period were multiplied by the period returns, and
- The results for each holding were added together, providing a portfolio return for the period of 4.5%.
Portfolio Method #2: The Beginning Versus the End
The second method uses an approximation equation that compares the total market value of all holdings at the end of the period to the total market value of all holdings at the beginning; it also adjusts for the impact of net additions or withdrawals to the overall portfolio.
The approximation equation is shown in the accompanying box. (Note that if there are no additions or withdrawals, there is no need to use an approximation equation; you would simply use the first return equation, which is your actual return.)
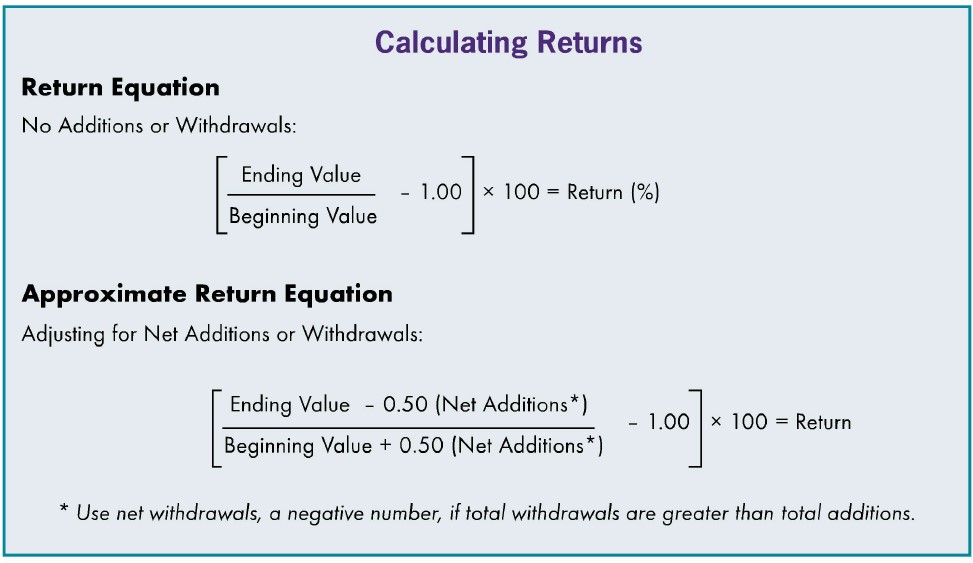
Adjusting for the impact of any net additions or withdrawals is important because money added to the original investment is not part of the investment’s return, but anything the addition earns is part of the return. Also, the timing of the addition or withdrawal can make a difference. For example, if you add $1,000 to a portfolio at the beginning of the year, it works for you (or against you if the investment sours) for a longer time than if you were to put it in at the end of the year, yet in both situations you have added the same amount—$1,000—to the same original portfolio value.
In the approximation equation, the adjustment for additions or withdrawals is made by decreasing the end value and increasing the beginning value by 50% of the net additions or withdrawals. This method creates a midpoint average for the cash flows no matter when they were actually made. However, the equation is more accurate when additions and withdrawals are relatively periodic and are not large (greater than 10%) relative to the total portfolio value.
The calculation is illustrated in Table 1 (Return Calculator #2) using the same portfolio as in Calculation #1.
In the example shown here, you can see that there were several withdrawals and additions to individual holdings. However, the overall portfolio had a net withdrawal of $4,000, as this investor apparently decided to use some savings for consumption.
How to Calculate Portfolio Method #2
Here’s how Calculation #2 was made:
- The portfolio was valued at $167,926.00 at the beginning of the period, and it was valued at $171,460.73 at the end of the period.
- The adjusted end value is $173,460.73 [$171,460.73 – (50% × –$4,000)]; note that subtracting a negative figure is the same as adding a positive number;
- The adjusted beginning value is $165,926.00 [$167,926.00 + (50% × –4,000)]; note that adding a negative figure is the same as subtracting a positive figure.
- Dividing the adjusted end value by the adjusted beginning value indicates the change in value for the period ($173,460.73 ÷ $165,926.00); in this example the end value is 1.045 times the beginning value.
- Subtracting 1.00 eliminates the beginning value, so the answer is in the form of an increase in value—the return—which in this example is a gain of 0.045, or 4.5% for the period. The result is the same as the return determined by the first method.
Of course, the resulting answers using the approximation method will not always be precise; in fact, the longer the time period covered, the less precise the approximation. However, it will be close enough for an individual to make informed decisions.
If the end value after adjusting for net withdrawals or additions is less than the beginning value, the division will produce a figure that is less than 1.00 (for example 0.80); subtracting 1.00 then produces a negative figure [0.80 – 1.00 = –0.20, or –20%], and the return represents a loss.
How to Measure Your Portfolio’s Performance
Measuring the performance of your total portfolio helps you to assess the accuracy of the long-term return assumptions you made when determining your asset allocation mix.
While you can compare your portfolio’s actual performance to your assumptions, you should also compare the assumptions and your portfolio performance to an index. Of course, indexes exist for asset classes, not entire portfolios, so you need to “create” your own index. You can do this following the method used in the first return calculation.
First, determine the percentage of your portfolio that is allocated to each asset class, and multiply the percentage by the total return for the appropriate index (be sure the return reflects price changes and any income generated).
The sum of these weighted returns is an appropriate index return that you can use to judge your portfolio’s actual return.
You should also compare this customized index return with the long-term return assumptions you used when you determined your asset allocation mix. If they are close, but your own portfolio returns are off, the individual holdings should be reviewed.
On the other hand, if your long-term assumptions are different than the customized index return, you may want to rethink your original assumptions. Taking stock of your total portfolio is necessary to make sure that you will meet your long-term goal.
How Often Should You Measure Your Portfolio’s Performance?
The equations shown here can be used for any length of time—weekly, quarterly or annually. However, portfolio measurement does not need to be done frequently—once a year is sufficient for most individuals.
If you do measure your portfolio’s performance more frequently—for instance, quarterly—you can determine the annual return by:
- Adding 1.00 to each quarterly return figure (in decimal form),
- Multiplying the four numbers and
- Subtracting 1.00 from the final figure. The result is the annual return in decimal form.
For instance, if the period returns in Table 1 were quarterly, and the prior three quarters were 3.0%, 1.2%, and 0.2%, the annual return would be: [1.03 × 1.012 × 1.002 × 1.045] – 1.00 = 0.091, or 9.1%.
However, if you measure portfolio performance frequently, don’t make hasty decisions based on short-term results. Use the short-term results to satisfy your curiosity and as a possible warning signal. But keep in mind that you are assessing a long-term strategy.
Your Portfolio’s Return: The Bottom Line
As an investor, you need to know if you’ll be able to fund your financial goals, and that’s where calculating your portfolio’s return can be extremely important. Although there are numerous ways to evaluate your performance as an investor, looking at your overall portfolio return during a certain time period will help you to understand your personal strategy.
Learning how to calculate your portfolio’s total return and successfully measure its performance is a crucial skill for investors of all experience levels.
Additional Resources on Portfolio Return
Want to learn more about allocation, portfolio performance and total return? Check out some of these resources:
- Determining Your Portfolio Management Preferences
- The Building Blocks of a Successful Portfolio Allocation
- The Impact of Asset Allocation on Retirement Income
- AAII Model Portfolios
This article was originally published in the August 2008 AAII Journal. Click here for a PDF of the original article.
Discussion
FREE REPORT

sri from IA posted over 15 years ago:
Jean from IL posted over 15 years ago:
Pasi from Finland posted over 14 years ago:
Elneta from CO posted over 14 years ago:
James from GA posted over 14 years ago:
Vaidy Bala from AB posted over 12 years ago:
You need to log in as a registered AAII user before commenting.
Log InCreate an account