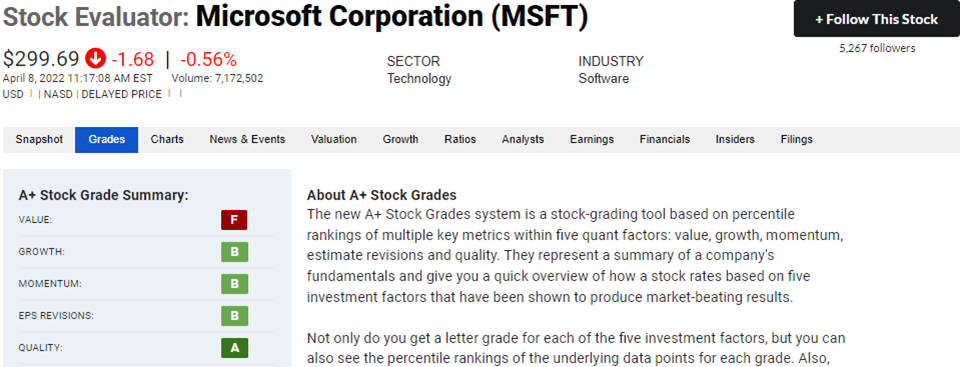
The A+ Stock Grades system is a stock-grading tool based on percentile rankings of multiple key metrics within five quant factors: value, growth, momentum, earnings per share (EPS) estimate revisions and quality. They represent a summary of a company’s fundamentals and give you a quick overview of how a stock rates based on five investment factors that have been shown to produce market-beating results.
Each factor grade is determined by a corresponding score, or percentile ranking, that is calculated and updated daily. The scores underlying each company’s factor grades can be viewed from within the Stock Evaluator, on the Grades tab in the gray ribbon near the top of the page. The Grades tab also presents a list of the stock’s competitors and their grades for a quick comparison.
To access a company’s Stock Evaluator page, type a company name or ticker in the search tool at the top-left of the AAII website, and then click on the company’s name in the drop-down list that appears.
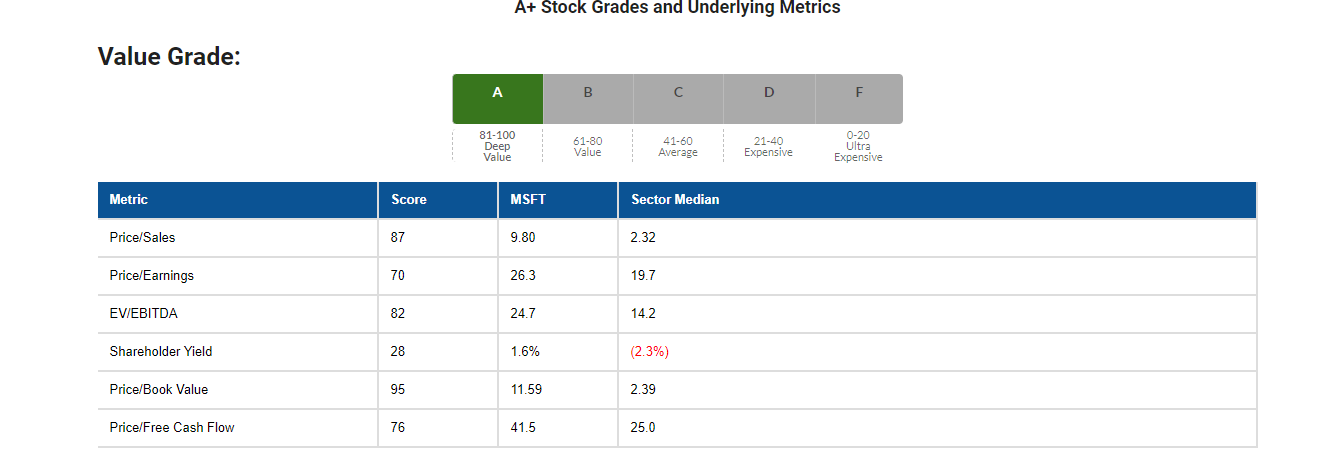
The Value Score is the percentile rank of the average of the percentile ranks of the price-to-sales ratio, price-earnings ratio, enterprise-value-to-EBITDA (EV/EBITDA) ratio, shareholder yield, price-to-book-value ratio and price-to-free-cash-flow ratio. The score is variable, meaning it can consider all six ratios or, should any of the six ratios not be valid, the remaining ratios that are valid. To be assigned a Value Score, stocks must have a valid (non-null) ratio and corresponding ranking for at least two of the six valuation ratios.
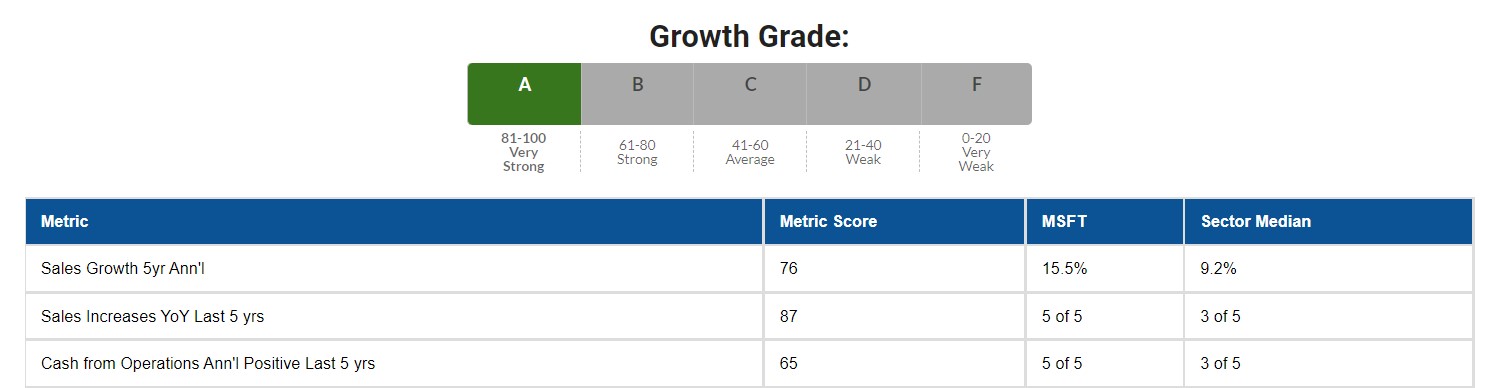
The components of the Growth Composite Score consider a company’s success in growing sales on a year-over-year (YoY) and long(er)-term annualized basis and its ability to consistently generate positive cash from its core operations.
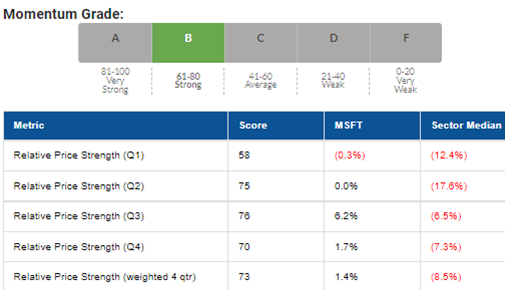
Momentum is based on the price change of a stock over a specified period relative to all other stocks. It is considered to be an anomaly in the analysis of stock returns because stocks with high relative levels of momentum tend to continue to outperform, while stocks with low relative levels of momentum tend to continue underperforming.
The Momentum Score is a weighted four-quarter relative strength rank. It is calculated using the relative price change for each of the past four quarters. The most recent quarterly price change is given a weight of 40% and each of the three previous quarters are given a weighting of 20%.
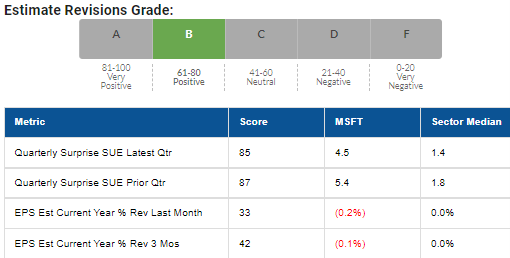
Academic studies have shown that companies that have seen strong upward earnings revisions or have reported significant earnings surprises can see an impact on share prices for up to a year.
The components of the Estimate Revisions Score examine the magnitude of a company’s earnings surprises for the last two reported fiscal quarters as well as the change in the consensus estimate for the current fiscal year over the last month and three months.
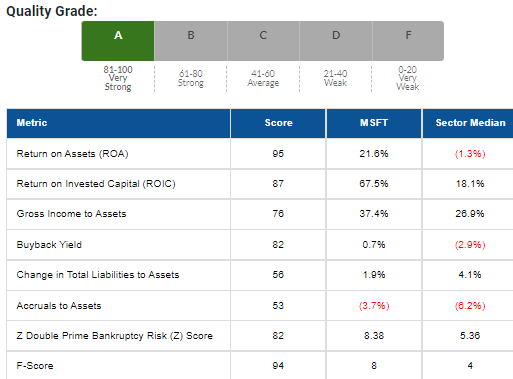
The Quality Score is used to assess the “quality” of a particular stock. A higher quality stock possesses traits associated with upside potential and reduced downside risk. Stocks receive better grades (higher scores) for having higher scores for the quality sub-components and worse grades (lower scores) for lower scores for the sub-components.
The Quality Grade is the percentile rank of the average of the percentile ranks of the return on assets (ROA), return on invested capital (ROIC), gross profit relative to assets, buyback yield, change in total liabilities to assets, accruals, Z double prime bankruptcy risk (Z) score and F-Score. The score is variable, meaning it can consider all eight measures or, should any of the eight measures not be valid, the remaining measures that are valid.