 VEURX
VEURX
As investors, having the ability to analyze investments systematically makes it easier to move from stock to stock or mutual fund to mutual fund and perform an apples-to-apples evaluation. This, in turn, will help you decide whether it is something you want to add to your portfolio or whether it is something you want to continue holding or outright sell.
For mutual fund and exchange-traded fund (ETF) investors, A+ Investor offers evaluators that allow you to evaluate funds you are considering buying or those you already own.
To access either, just type in the mutual fund or ETF name or ticker in the search box at the top-left of the AAII website (www.aaii.com) and when it appears via the autofill drop-down box, click on the fund name. This takes you to the Fund (or ETF) Evaluator:
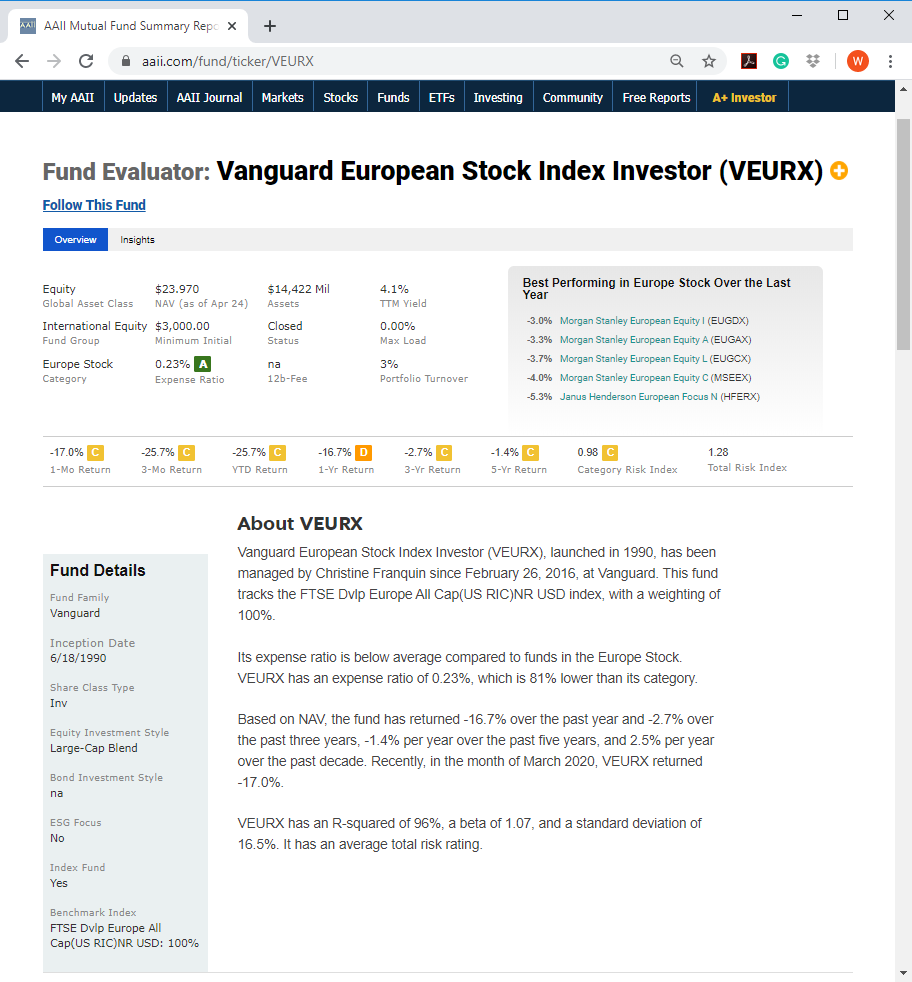
[Editor’s Note: Our database does not currently include closed-end funds, but we are looking into the possibility of adding them down the road.]
You will see two tabs: Overview and Insights. Both can help you quickly assess a fund’s attractiveness.
The Overview tab, as the name describes, gives you information about the fund.
For the Vanguard European Stock Index fund (VEURX), you can see its Global Asset Class (Equity), Fund Group (International Equity) and Category (Europe Stock).
Here, you will also find important statistics such as the fund’s assets under management, its yield, expense ratio and—for mutual funds—the minimum initial purchase amount and 12b-1 fee. You’ll also see grades associated with several data fields. These grades measure a fund’s costs, returns and risk against its category peers. Grades of A or B signal that the fund is better than its category peers for a specific statistic, such as three-year return. Grades of D or F signal that the fund is worse than its category peers.
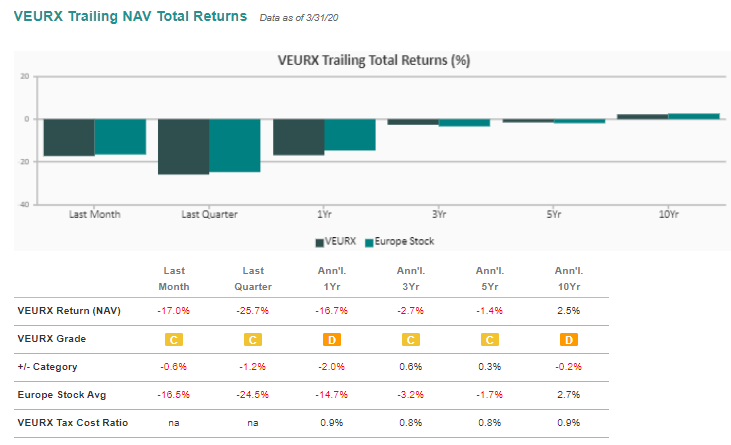
As you scroll down through the overview, you will find that it offers trailing and annual performance figures for up to 10 years, along with grades showing how the fund stacks up against other funds in its category on a year-by-year basis for performance. Here you will also see the magnitude by which the fund has outperformed or underperformed its category year to year and over a variety of period lengths (+/- Category).
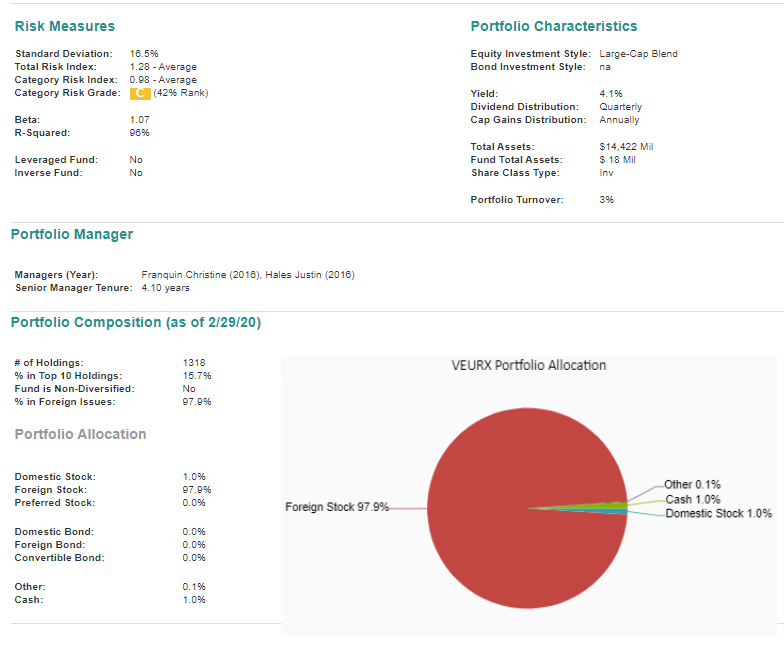
Scroll down further and you will find information about the fund’s risk profile, such as standard deviation and total risk index, as well as how volatile the fund is relative to other funds in the same category. The fund’s portfolio composition data includes the overall number of holdings, the portfolio concentration of the top 10 holdings and percentage concentration in foreign holdings.
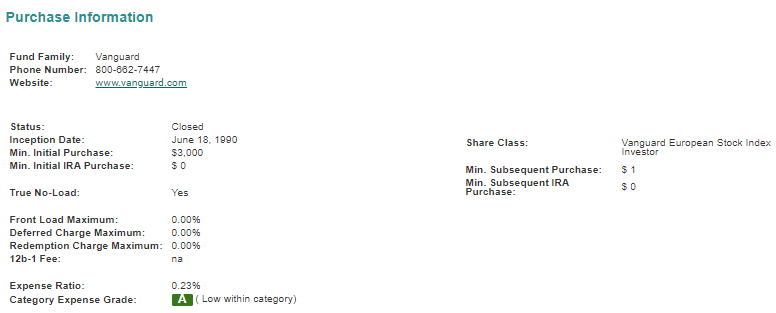
For mutual funds, the purchase information section includes whether the mutual fund is open to new investors and the minimum initial purchase amount. There is also a breakdown of the fees the mutual fund charges, such as front loads, deferred charges redemption charges and 12b-1 fees. A letter grade shows how low a mutual fund’s expense ratio is relative to the funds in the same category.
Clicking on the Insights tab gives you a quick qualitative analysis of the fund. It will tell you areas where the fund has fared strongly as well as highlight how consistently it has performed over the past 10 years. It makes getting a quick assessment of a fund easy.
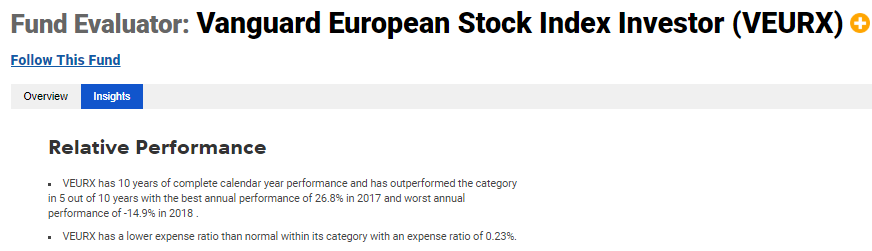
In the case of the Vanguard European Stock Index fund, it has outperformed its category for five of the last 10 years. In addition, the fund has an expense ratio lower than the typical fund in its category.

