This month, we continue our series on the A+ Investor enhancements within the new AAII Investor Hub. New rollouts include the long-awaited broker integration in My Portfolio and improved usability of the AAII Stock Screens. Plus, we recently held a webinar to walk members through all the features of the Investor Hub.
You can now securely connect your brokerage account (e.g., Charles Schwab, Vanguard, E-Trade) to track your securities on My Portfolio. Broker integration is provided via the Plaid network. Plaid is a read-only application widely used in the financial industry. Plaid only provides us with your portfolio holdings in the accounts you choose in a read-only format. We cannot alter or edit your portfolio holdings.
Go to My Portfolio at and select the + New Portfolio button. At the Create a New Portfolio pop-up window, choose Link A Brokerage Account and follow the steps provided.
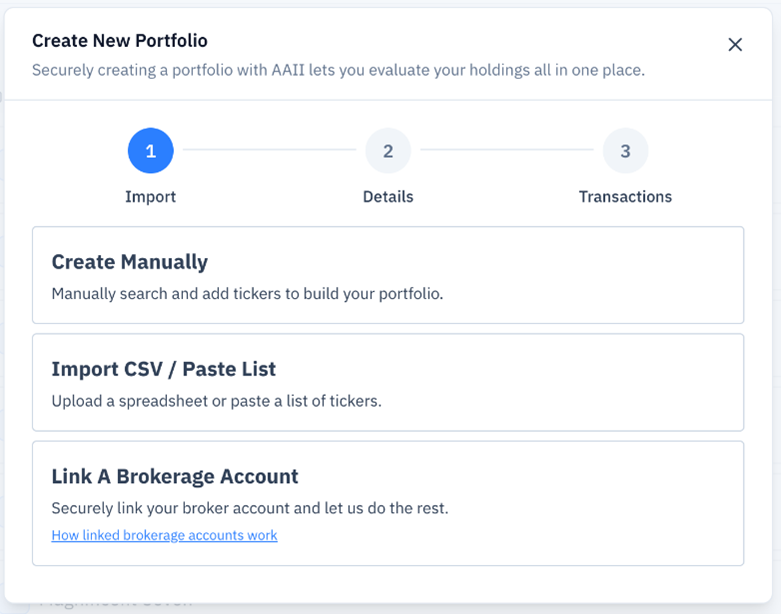
Linking your broker account allows your holdings and cost basis data to be automatically imported into My Portfolio, with no manual entry required. Linked brokerage accounts can be synced daily.
Once your account is connected, you’ll be able to set up custom views for your holdings with metrics that include key financial ratios like the payout ratio, financial statement data, current and historical valuation and yield information, relative strength measures, and much more. To create a custom view, either select Create Custom View from the View drop-down menu above your list of holdings or select Manage Custom Views on the upper-right side of the My Portfolio page and click the + New View button. There are over 2,000 data fields to choose from, and A+ Investor and AAII Platinum subscribers can create an unlimited number of views, which can be accessed online or downloaded as a spreadsheet.
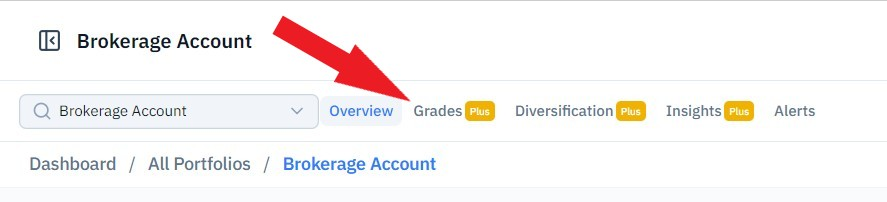
You can also view the A+ Stock Grades of your brokerage holdings to see how your stocks rank on their fundamentals. This button is located at the top of all portfolio pages within My Portfolio.
Plaid is a well-known, well-respected integrator of financial information. It is used by thousands of banks and credit unions—including Bank of America, Chase, Citibank and Wells Fargo. Many brokerage and investment firms also work with Plaid. Those firms include, but are not limited to, Charles Schwab, E-Trade, Interactive Brokers, Robinhood and Vanguard. (Note: Fidelity is an exception among major brokers as it does not work with Plaid. Fidelity has its own connection system. We are exploring how to integrate it into My Portfolio.)
When you link a brokerage account to My Portfolio, we do not store or see your login information. Our tool simply connects you to Plaid using a token that identifies you as a unique user. Plaid then sends you securely to your broker to log in. Your brokerage account login credentials are not stored. The only thing AAII stores is the token used by Plaid to identify who you are.
You always retain the ability to control which accounts are synced. You can also stop syncing and delete an account and the portfolio data from My Portfolio anytime you wish.
The new AAII Investor Hub makes it easier than ever to use the popular AAII Stock Screens. The new navigation allows you to quickly analyze the 55 screens by performance, risk and return, yearly performance, characteristics, and power rankings. Jumping between these options simply requires clicking on a tab at the top of the All Screens page.
You will also see a brand-new interface once you click on a stock screen. The key characteristics for each screen are right at the top of the page. These include types of stocks the screen finds (value, momentum, etc.), the average number of passing stocks and turnover. (Turnover measures how often the list of passing stocks changes; higher values mean more frequent changes.) You can also see the average A+ Grades for the stock screens. The performance data can be printed or downloaded as a spreadsheet for further analysis.
Charting functionality on the individual screen pages is also greatly improved. You can now click anywhere on the Performance chart to see how the screen fared for a particular month. This helps you better identify times when the screen has historically performed well or struggled.
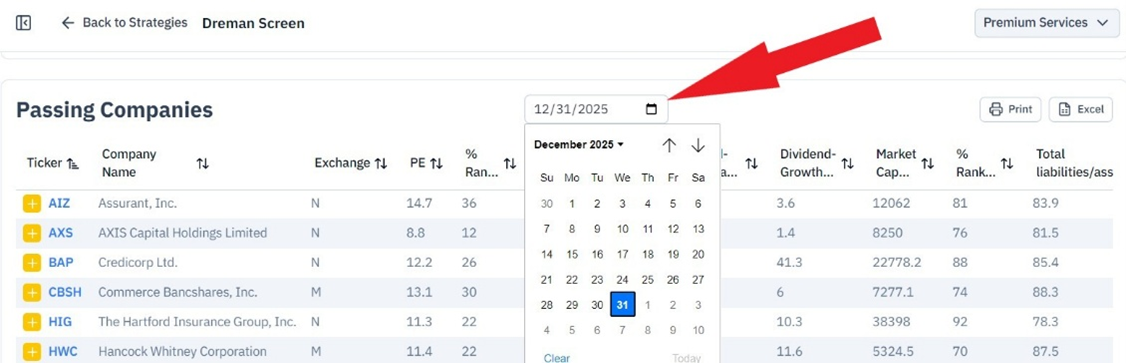
In response to a frequent member request, we’ve added the ability to access historical lists of passing companies for each screen, with data dating back to fall 2024. Look for the calendar above the list of passing companies and choose the date you are interested in.
On top of all these changes, we’ve redesigned the AAII Investor Hub home page too. It now provides a snapshot of your portfolios, including your favorited portfolio. An overview of the AAII Stock Screens, personalized selections of AAII commentary and your My Library are also easier to find on the Investor Hub home page.
Our artificial intelligence (AI) chatbot, James, remains accessible on the home page and elsewhere in the Investor Hub. It is solely trained on the AAII knowledge base and information.
You can adjust the theme and appearance of the AAII Investor Hub. This is useful for those who prefer light or dark backgrounds and/or prefer a certain level of contrast. You can find those settings by clicking on the drop-down menu showing your AAII.com username in the upper-left corner of any page on the Investor Hub.
For a guided tour of the new Investor Hub, please watch our webinar, “The New Way to Track and Analyze Investments.” Find out what’s new, why the enhancements were made and how to use the tools to better monitor and manage your portfolio.
Go to the Help & Support section of the Investor Hub to access the updated My Portfolio User Guide and Stock Screens FAQ.
If you haven’t already started taking advantage of the AAII Investor Hub, we encourage you to do so today. It makes two of the most popular tools on AAII.com—My Portfolio and the AAII Stock Screens—easier to use than ever. Plus, other new features are coming to the Investor Hub to help you get even more out of your A+ Investor subscription. Log on to the AAII Investor Hub with your AAII credentials to get started.

