Research confirms that momentum is as significant a characteristic to seek in a stock as value, size or volatility. Momentum is not merely for short-term traders and those who rely on technical analysis, but also for those who focus on fundamental analysis.
Price momentum is normally measured by comparing the price change of a stock over a specified period relative to a benchmark, such as the S&P 500 index, or against a segment of stocks; the resulting number is called relative strength. If shares of JPMorgan Chase & Co. (JPM) gain 20% and shares of Bank of America Corp. (BAC) rise by 5% over the same period, JPMorgan will have better relative strength. Its stock performed better than Bank of America’s stock did in the same amount of time.
Relative strength has grown in popularity as a characteristic used in selecting stocks. A number of research studies and successful investors have highlighted the benefit of seeking out stocks with high relative strength, especially when combined with other fundamental selection characteristics, such as size and value.
Price momentum is often used as a signal that the market has recognized that the stock price is reacting to the investing concept. Investors look for stock price performance better than that of other stocks in the belief that the rising price will attract other investors, who will drive up the price even more. Relative strength’s utility is built on the belief that relative strength persists over time. Momentum is considered to be an anomaly because if the market was pricing in all known information, then a stock’s future returns shouldn’t be influenced by past returns.
In “What Works on Wall Street” (McGraw-Hill, 2011), James O’Shaughnessy’s findings show a performance advantage to using both six- and 12-month relative strength. In both cases, stocks with relative strength in the top 30% or higher had annualized returns of approximately 12% or higher versus 10.5% higher for his all-stock universe. O’Shaughnessy’s data is for the period of 1927 through 2009. Other studies show a performance advantage to using 13-week relative strength as well as the aforementioned time periods.
There are several ways to measure the price performance of a stock, typically on either an absolute or a relative basis. Price change over a specified period is an example of absolute performance, while relative performance communicates how well a stock has performed compared to some benchmark, usually a market or industry index. The most basic means of calculating relative strength is by dividing the percentage price change of a stock over some time frame by the percentage change of a market index over the same period.
The concept of momentum is accepted in academic and practitioner circles, with some researchers theorizing that momentum reflects herding behavior. Investors with limited information will favor what’s popular and what has outperformed recently. This fits within the theory of investors preferring winners over losers, as well as behavioral tendencies such as recency bias, which is the tendency to think current trends will continue into the future.
Though momentum has been shown to lead to good returns, it’s not appropriate for every strategy. Its downsides can give investors reason for pause. Momentum does not have staying power on an aggregate basis. While some stocks can retain high levels of relative strength for an extended period of time, relative outperformance is fleeting for others. Research found momentum’s advantage to wane after a period of one year for the average stock. Due to the lack of staying power, portfolio turnover can be higher than it is with other factors.
A far bigger concern with momentum is the potential for the factor to backfire or “crash.” This occurs when stocks with the worst past relative performance (e.g., over the past 12 months) outperform those with the best relative performance. Returns are adversely affected by buying winners and selling or avoiding losers. Momentum crashes are caused by a shift in sentiment. The past losers rise at a faster pace than the past winners do. This results in underperformance for past winners and negative returns for a portfolio that has a long position in past winners and a short position in past losers.
Subscribers to A+ Investor can view Stock Grades based on the momentum factor for a given company. The Momentum Grade uses the weighted four-quarter relative strength price change for each of the past four quarters to rank companies. The most recent quarterly price change is given a weight of 40% and each of the three previous quarters are given a weighting of 20% (below). The weighted four-quarter relative strength price score for Microsoft Corp. (MSFT) is 83 as of the close on May 29, 2020. Microsoft’s weighted price performance was 11% greater than that of the S&P 500 over the same period, while the technology sector median was only 2.0% higher than the benchmark.
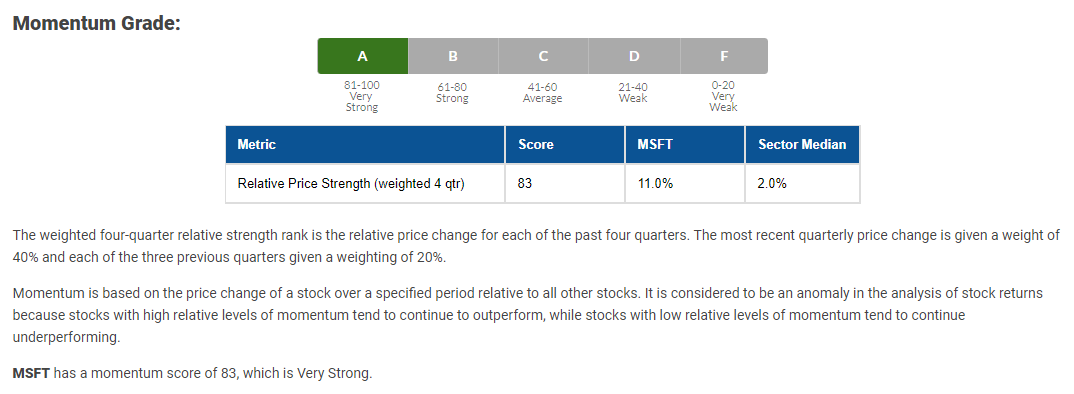
Company performance that is equal to that of the S&P 500 is represented by a relative strength index score of 0%; companies outperforming the S&P 500 have positive relative strength figures while those underperforming the S&P 500 have negative relative strength values.
One way to mitigate the downsides of momentum is to combine it with value. This diversifies the portfolio by risk factor or, more intuitively, by style. Research shows that from a quantitative standpoint, momentum and value are negatively correlated. Negative correlation is a relationship between two variables whereby they move in opposite directions. In terms of style performance, if “growth” and “value” have a negative correlation, when growth investments increase in value, value investments will decrease and vice versa.
Due to this lack of correlation, combining momentum with value results in diversification benefits. It not only helps to offset momentum crashes, but it can also reduce both volatility and turnover.
Momentum can be fast-moving. It seeks out stocks that are currently doing well from a return standpoint. A stock that is outperforming the market can be reflective of an expectation that the business is doing well and/or may improve in the foreseeable future. Investors may be attracted to such stocks because of their good returns. As such, valuations tend to be higher.
Value, in contrast, can be slow-moving. It seeks out stocks whose valuations are below the market’s average. The lower valuations can reflect concern about the business not doing well or being unlikely to realize better-than-forecast rates of return. Such stocks may be overlooked as investors fret about whether the valuation is cheap for a reason or if these stocks are riskier. As such, the relative strength can be lower.
From a quantitative standpoint, momentum and value are negatively correlated. Clifford Asness et al. found value to have a –0.4 correlation with momentum. To put this number into perspective, a correlation of 1.0 would imply that the two styles move in lock-step, a correlation of –1.0 would imply they move in opposite directions, and correlation of 0.0 would imply they move independently of each other. The correlation of –0.4 suggests that momentum and value lean toward being independent, but when one zigs, the other may have a tendency to zag.
Due to this lack of correlation, combining momentum with value results in diversification benefits. It not only helps to offset momentum crashes, but it can also reduce both volatility and turnover. Researchers Gregg Fisher, Ronnie Shah and Sheridan Titman found that portfolios using a 50% value/50% momentum mixture had less volatility and lower turnover than a pure momentum portfolio, as reported in their 2016 Journal of Investment Management article “Combining Value and Momentum.” Depending on whether large- or small-cap stocks were held and the buy and sell rules followed, absolute returns and risk-adjusted performance (as measured by the Sharpe ratio) were as good as or better than standalone value or momentum strategies.
It should be added that it’s more important to incorporate value and momentum strategies rather than to seek the exact optimal mix. While Fisher et al. used a 50/50 mix, Asness et al. looked at a 60/40 value/momentum portfolio. Using French’s dataset, they found that this mix “effectively eliminated crashes in our long-term sample evidence—and not just those for momentum, but also the crashes that can occur for value investing.”
The French data identifies value as stocks trading at low price-to-book (P/B) ratios, segmenting stocks based on breakpoints for NYSE-listed stocks. An alternative method is to seek out stocks with high levels of shareholder yield and strong price momentum. Shareholder yield is the combination of dividend yield and buyback yield. In “What Works on Wall Street,” O’Shaughnessy found this to be an effective strategy.
Using the A+ Stock Grades Screener, you can isolate stocks that simultaneously grade highly for value and momentum. For this example, we first filtered out those stocks that do not have an “A” Value Grade. As of the close on May 29, there were 1,135 companies in the approximately6,100 stock universe with a Value grade of A.
We then wanted to isolate only those companies that also rated “A” with the A+ Momentum Grade. That left us with 61 companies.
Sixty-one companies is still too large of a universe for us, so we then required a “D” or better for Growth, Revisions and Quality. This left us with 17 companies:
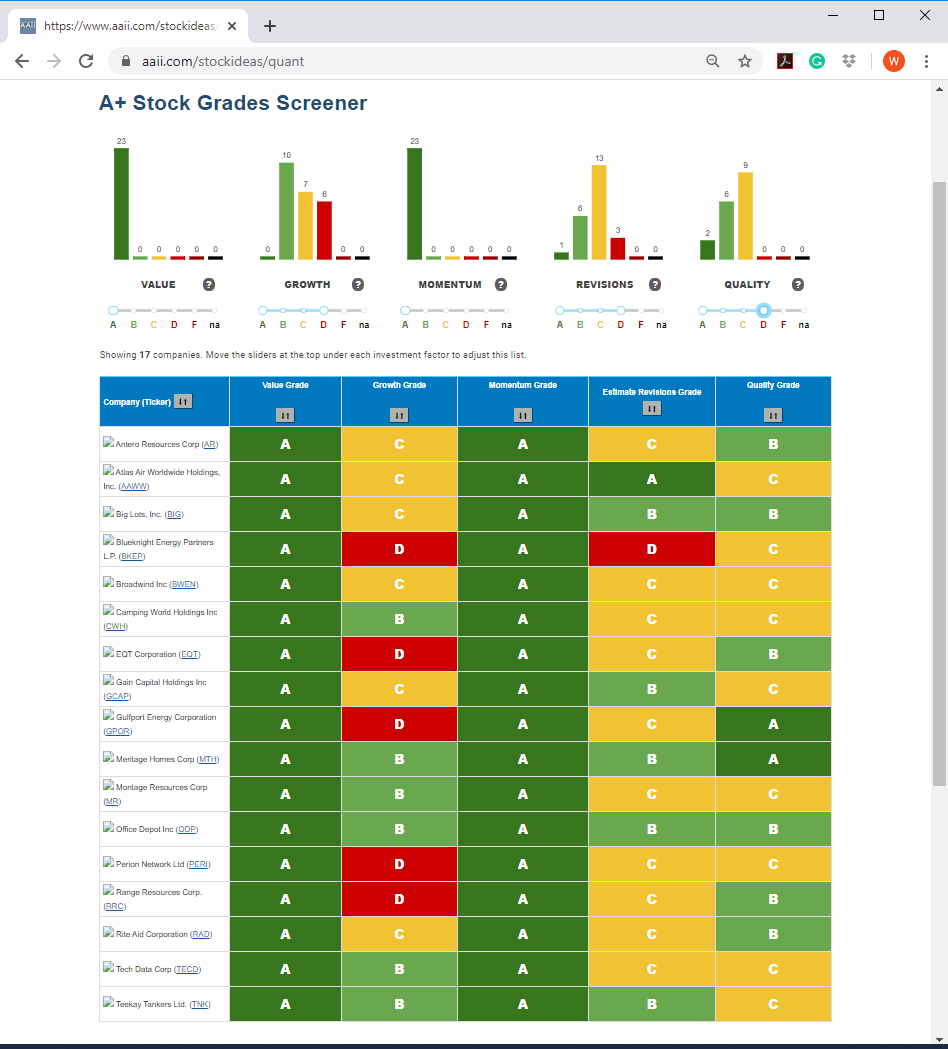
On this list we see some familiar names, including Big Lots Inc. (BIG), Camping World Holdings Inc. (CWH), Office Depot Inc. (ODP) and Rite Aid Corp. (RAD).
When interpreting relative strength, it is important to note that even a stock that is rapidly rising in price may have weak relative strength if the market is rising faster than the stock. Likewise, a stock that is falling in price will show positive relative strength if it is declining more slowly than the overall market.
The concept of momentum using relative strength can be a revealing and useful investment analysis tool to consider as you look for stock ideas and manage your holdings. Momentum has been associated with higher returns over the long term.


