There is a saying that “you need money to make money,” but how much you pay to invest can have a significant impact on how much money you ultimately end up with.
There is also the saying that “there is no such thing as a free lunch.” When you are investing, especially in mutual funds, there are often fees and costs involved, some of which are not readily apparent.
Many investors do not pay a lot of attention to how much they are paying to own a mutual fund. That could be a costly mistake, because these investment costs add up, compounding right along with your investment returns.
Not only do you lose the “small” amount of fees you pay, but you also give up all the growth that money might have had for years into the future.
Here is a simple example. Imagine you have $100,000 invested. If the account earned 5% a year for the next 25 years and had no costs or fees, you would end up with almost $340,000.
If, on the other hand, you paid 2% a year in costs, after 25 years you would only have about $210,000.
The 2% you paid every year would erase almost 40% of your final account value over 25 years. That seemingly innocuous 2% cost has turned into some serious money.
Because all investments have costs, it might seem like there is no need to worry about them. Some people even believe that “you get what you pay for” and assume that a higher fee means higher quality.
Research tells a very different story: higher-cost funds generally underperform lower-cost funds. According to Vanguard, the median U.S. stock fund in the highest-cost quartile had an average yearly return of 6.9% for the 10 years ended December 31, 2014, while the median fund in the lowest-cost quartile had an average yearly return of 7.8%. The median U.S. taxable bond fund in the highest-cost quartile had an average yearly return of 4.0%, while the median fund in the lowest-cost quartile had an average yearly return of 4.4%.
Also, be aware that some funds may charge very low expense ratios but add front- and back-end loads. Or they may offer an “introductory” or short-term expense ratio that increases down the road. Or they charge extremely low fees on one fund only to jack up costs on the others to make up for it.
The bottom line? There are definitely some things you should not worry about when it comes to investing. But costs are one of the driving factors that dictate whether you will reach your desired goal. Furthermore, costs are one of the only factors completely within your control. So, give them the time and attention they deserve.
Using the A+ Investor Funds Screener reinforces the notion that lower-cost funds perform better than high-cost funds.
For this example, we screened for small-cap value U.S. equity funds that are open to new investors and are not institutional shares.
We then screened for those funds that have an expense ratio that ranks in the top 10% of its category and the bottom 10% of its category (image below).
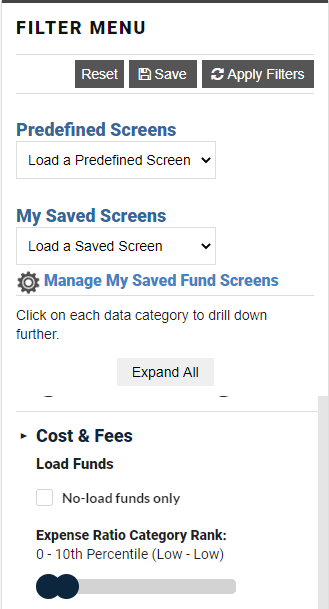
The expense ratio of a mutual fund is the total percentage of fund assets used for administrative, management, advertising (12b-1) and all other expenses. An expense ratio of 1% per annum means that each year 1% of the fund’s total assets will be used to cover expenses.
As of May 31, 2020, there were 32 U.S. equity small-cap value funds with expense ratios that rank in the top 10% of their categories. Among these 32 funds, 28 have been in existence for at least 10 years. The median 10-year return for the 28 funds in existence for at least 10 years is 5.2%.
The median expense ratio for the 28 funds ranking in the top 10% of their category in terms of expense ratio is 2.13%. Dunham Small Cap Value A (DASVX) and Goldman Sachs Small Cap Value Insights C (GSCTX) tied for the lowest expense ratio at 1.97%. ProFunds Small Cap Value Services (SVPSX) has the highest expense ratio in this group at 2.74%.
For those funds with an expense ratio in the top 10% of its category, the one with the best 10-year performance is Olstein Strategic Opportunities C (OFSCX) with an annualized return over the last 10 years of 6.5%. At the other end of the spectrum, Rydex S&P SmallCap 600 Pure Value C (RYYCX) has returned 0.3% a year over the last 10 years.
Looking at the small-cap value U.S. equity funds that are open to new investors and are not institutional shares that rank in the bottom 10% of their category for expense ratio, there were 16 funds as of May 31, 2020. Among these 16 funds, 11 have been in existence for at least 10 years. The median 10-year return for the 11 funds in existence for at least 10 years is 6.9%.
The median expense ratio for the 11 funds ranking in the bottom 10% of their category in terms of expense ratio is 0.75%. American Century Small Cap Value G (ASVHX) has the lowest expense ratio for the 11 funds at 0.00%. Three funds in this group tied for the highest expense ratio at 0.85%.
For those funds with an expense ratio in the bottom 10% of its category, the one with the best 10-year performance is JPMorgan Undiscovered Managers Behavioral Value R6 (UBVFX) with an annualized return over the last 10 years of 8.0%. Sterling Capital Behavioral Small Cap Value Equity R6 (STRBX) was the laggard among these 11 funds, averaging a return of 5.4% a year over the last 10 years.
Here are the 10 funds from the group with the highest 10-year annualized return:
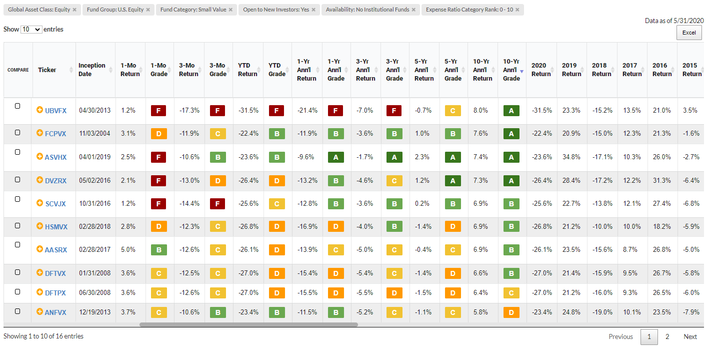
This example shows that, on average, lower-cost mutual funds outperform high-cost funds over the long term. Using the A+ Investor Funds Screener, you are able to screen for funds with expense ratios that rank very low in the category based on expense ratio.
As the data presented here shows, ignoring the cost of owning a mutual fund can have a severely negative impact on your portfolio’s performance.


