 EMQQ
EMQQ
A couple of weeks ago I had the privilege of moderating AAII’s Webinar Wednesday featuring Kevin Carter, the founder of the EMQQ Emerging Markets Internet & E-Commerce ETF (EMQQ) and the chairman of the EMQQ Index Committee. This program is available for replay by clicking this link.
The EMQQ Emerging Markets Internet & Ecommerce ETF is an exchange-traded fund (ETF) that tracks an index of leading internet and e-commerce companies serving emerging markets. It seeks to offer investors exposure to the growth of online consumption in the developing world. EMQQ holdings operate in diverse markets such as India, China, Brazil, Turkey, Nigeria and Indonesia, to name a few. To be included, the companies must derive their profits from e-commerce or internet activities and include search engines, online retail, social networking, online video, e-payments, online gaming and online travel.
The EMQQ Index provides diversified exposure to the internet and e-commerce sectors of emerging and frontier markets in Asia, Latin America, Africa, the Middle East and Eastern Europe. The index covers over 40 companies operating in emerging and frontier markets including China, India, Brazil, Russia, South Korea, Taiwan, South Africa, Mexico, Argentina, Malaysia, Thailand, Indonesia, Vietnam, Philippines, Turkey, Czech Republic, Poland and Colombia.
To give you an idea of how you can use A+ Investor ETFs analysis tools, I am going to run through an analysis of the EMQQ ETF. As an aside, AAII is not receiving any consideration from EMQQ for this analysis and I do not own shares of EMQQ, nor do I plan on buying any shares in the coming weeks.
Researching an ETF
A+ Investor provides ETF evaluator pages for over 2,000 exchange-traded funds. You can access the ETF Evaluator for a specific ETF by typing the ticker (or name) into the search box at the top-left of each AAII webpage:
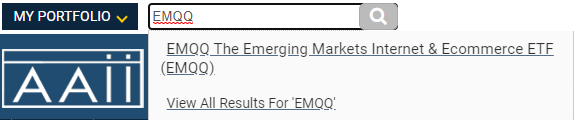
The search function’s autofill will show the results for any matching ticker (or name) and you click on the name and ticker to load that ETF’s Evaluator page:
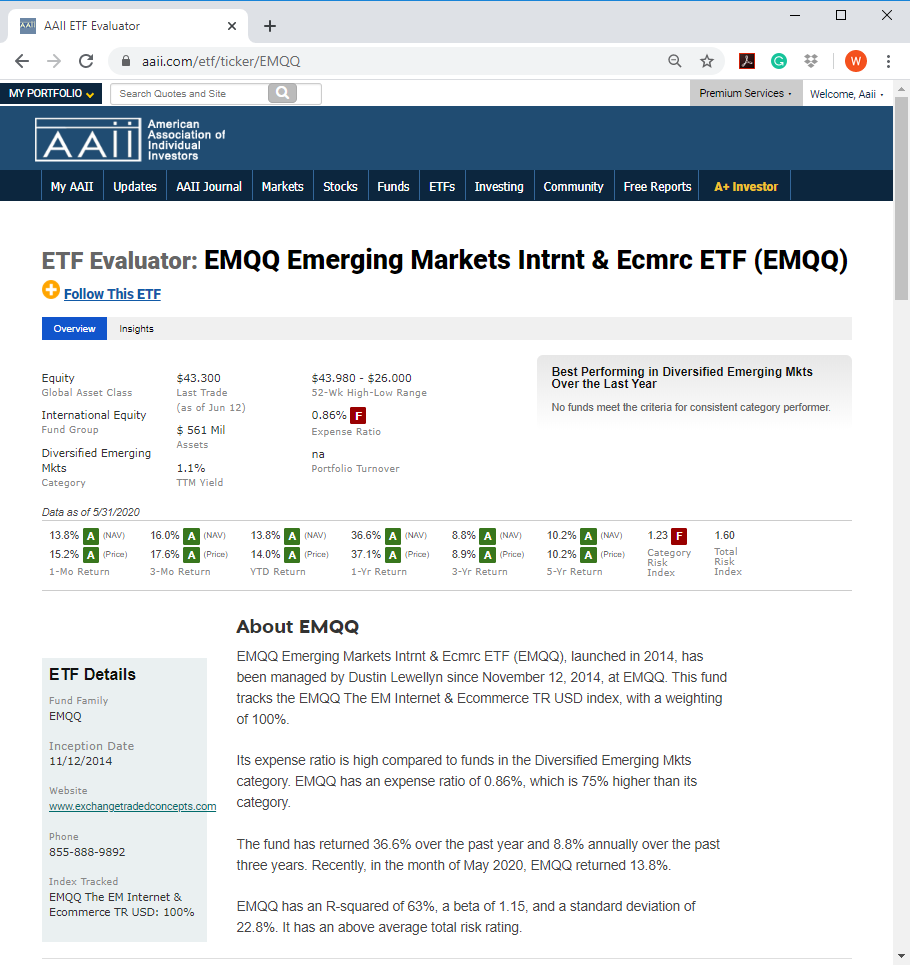
Note: All data on the Evaluator pages are updated monthly from Morningstar, with the exception of Last Trade price, which is updated intraday for ETFs during regular trading hours and daily for mutual funds.
On the ETF (or Fund) Evaluator, there are two tabs: Overview and Insights. Both can help you quickly assess a fund’s attractiveness.
The Overview tab, as the name describes, gives you information about the fund. Here, you will find important statistics such as the fund’s size, its yield, expense ratio and—for mutual funds—the minimum initial purchase amount. You will also notice the fund’s grades. These grades measure a fund’s returns and risk against its peers. Grades of A or B signal that the fund is better than its category peers for a specific statistic, such as three-year return. Grades of D or F signal that the fund is worse than its category peers.
Reviewing the Evaluator for EMQQ, we see that it is in the Equity Global Asset Class, which means its portfolio is made up primarily of stocks. Drilling down, we learn that the ETF is in the International Equity Fund Group and Diversified Emerging Markets Category (all of these designations come from Morningstar).
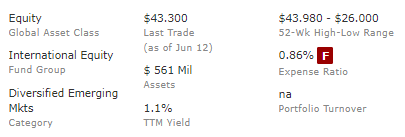
As of the end of May, the ETF had $561 million in assets and a trailing 12-month yield of 1.1%.
Over the last 52 weeks, the ETF has traded between $26.00 and $43.98 and closed on June 12, 2020, at $43.30.
We see that EMQQ has an “F” when it comes to its expense ratio. The ETF has an expense ratio of 0.86%, which we learn in the About EMQQ section of the Overview tab is 75% higher than the category average. While the expense ratio isn’t unreasonable on an absolute level, comparing expenses for funds in the same category provides a more apples-to-apples comparison. Even then, though, it is important to understand the investment style of the fund you are analyzing and any funds you compare it against.
We also see a number of colored letters, which represent A+ Investor grades. Depending on the data point you are reviewing, the A+ grade provides an indication of how the ETF (or fund) stacks up against funds in the same category (in this case, Diversified Emerging Markets).

Across the board, EMQQ has outperformed the average fund in the Diversified Emerging Markets category based on both price and net asset value (NAV). This outperformance has been significant enough to rate an “A” across all the stated periods. The fund started in 2014, so it only has five full calendar years of performance data.
This outperformance has come with higher risk than the typical ETF in EMQQ’s category. The fund has a Category Risk Index “F” grade. Morningstar’s risk index is a statistic that evaluates a fund’s downside volatility relative to the other funds in its Morningstar category. To calculate risk, Morningstar concentrates on those months during which the fund underperformed the average return of a three-month Treasury bill. The amounts by which the fund fell short of the Treasury bill’s return are added together and the result is divided by the total number of months in the rating period. The fund’s average monthly loss is then compared with the average monthly loss for the fund’s Morningstar category. The resulting risk rating expresses how risky the fund is relative to the average fund in its Morningstar category. So when evaluating an ETF or mutual fund, it is useful to balance its short-term and long-term performance, as well as having a sense for its downside risk.
About Section
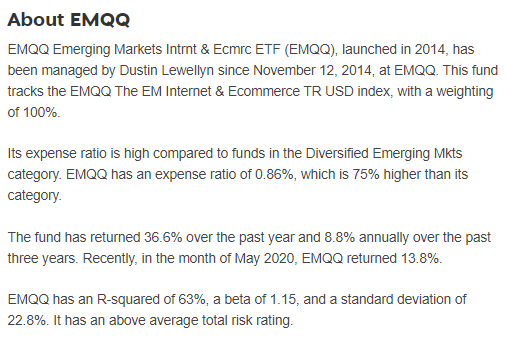
The About section of the Evaluator Overview tab offers a narrative of some of the data found on the page.
Trailing NAV Total Returns
Further down the Overview tab, we see trailing total returns and annual total returns. Some of the data on these tables is a reproduction of the performance data at the top of the page. However, these two tables offer more granulator data comparing the fund to its category.
In the case of EMQQ, it has outperformed the average ETF in the Diversified Emerging Markets category over the last month, quarter, year and on an annualized basis over the last three and five years. The magnitude of that outperformance is why EMQQ receives “A” grades for performance over the stated periods. While EMQQ has generated positive returns over the various periods, the average fund in the Diversified Emerging Markets category has posted negative returns, with the exception of the month of May and over the last 10 years (annualized return of 1.7%).
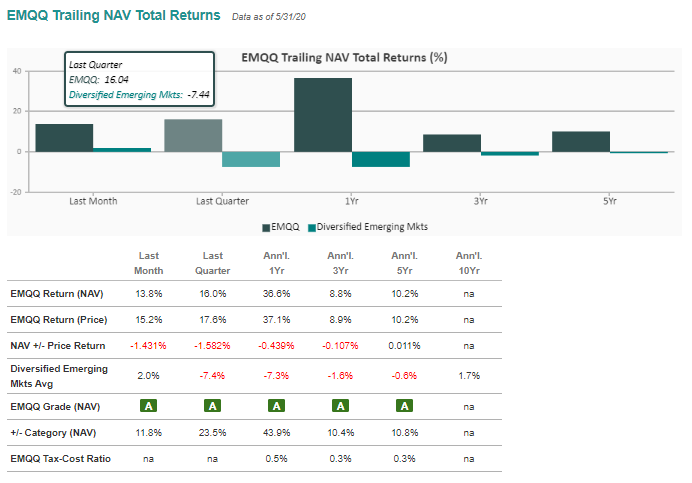
The price return for an ETF is just that, the return based on the price at which it trades. In contrast, the NAV return uses the ETF’s change in net asset value over time to calculate return. NAV can differ from a fund’s market price since it is computed end-of-day, while the securities held inside of a fund trade throughout each trading day.
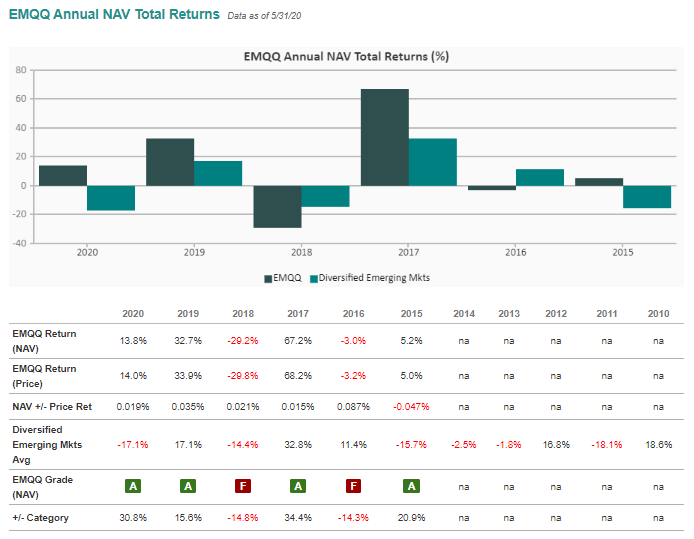
Annual NAV Total Returns
The annual total returns table provides the same level of detail as the trailing total returns table, except it looks at the last 10 calendar years (when available). Since EMQQ started at the end of 2014, there is only annual data going back to 2015. In three of the five years that EMQQ has traded, it has outperformed the average fund in its category. However, when it did underperform, in 2018 and 2016, it underperformed the vast majority of funds in its category, which is why it received “F” grades for those two years.
Portfolio Statistics
The Portfolio Statistics section of the ETF (and Fund) Overview tab provides high-level information about the ETF. For example, it exactly matches its tracking index, the EMQQ Emerging Markets Internet & E-Commerce index. It also appears that there is no turnover in that index, as Morningstar reports 0% turnover for the ETF.
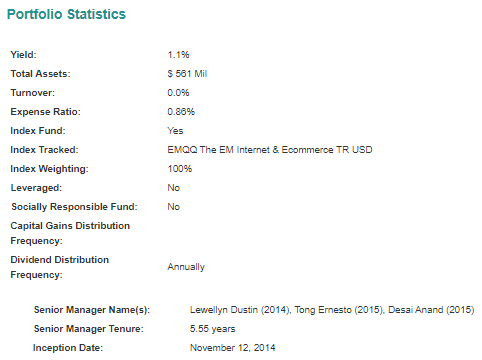
In addition, we see that the ETF has been managed by Dustin Lewellyn since the fund’s inception on November 12, 2014.
Portfolio Composition
The Portfolio Composition section of the Evaluator Overview tab provides a detailed breakdown of the ETF’s holdings.
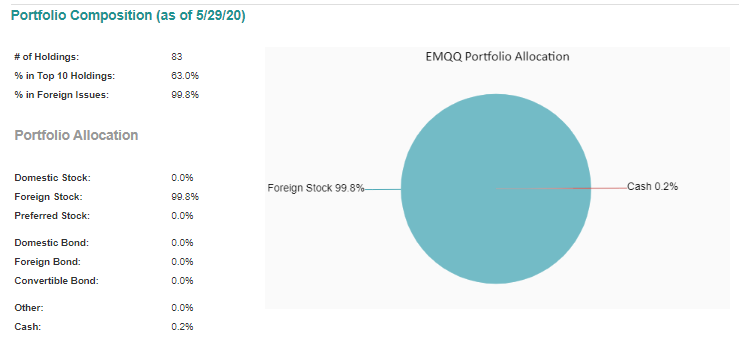
As of May 30, 2020, EMQQ held 83 stocks. The top 10 holdings among those 83 stocks account for 63% of the fund’s total investment and 99.8% of the ETF’s holdings are in foreign stocks. The remaining 0.2% of the fund’s portfolio is held in cash.
Risk Measures
In the Risk Measures section, we see that EMQQ’s R-squared is 63%. This means that 63% of the movement in the fund’s returns is explained by movement in the S&P 500 large-cap index. An R-squared of 0% indicates that the S&P 500 is responsible for none of the movement in the fund’s returns and 100% indicates that the S&P 500 explains all the movement of fund’s performance. In investing, a high R-squared—between 85% and 100%—indicates that the stock or fund’s performance moves relatively in line with the index. A fund with a low R-squared, at 70% or less, indicates that the security does not generally follow the movements of the index.
A higher R-squared value will indicate a more useful beta figure. For example, if a fund has an R-squared value of close to 100%, but has a beta below 1, it is most likely offering higher risk-adjusted returns. In the case of EMQQ, we see from its Evaluator Overview tab that it has a beta of 1.15.
EMQQ has a Category Risk Index value of 1.23. As stated, this risk index is a statistic that evaluates a fund’s downside volatility relative to the other funds in its Morningstar category. In this context, EMQQ has downside volatility that is 23% greater than the average fund in its category.
Standard deviation is a statistical measure of the range of a fund’s performance. When a fund has a high standard deviation, its range of performance has been very wide, indicating that there is a greater potential for volatility. The standard deviation figure provided here is an annualized statistic based on 36 monthly returns. EMQQ has an annual standard deviation of 22.8%.
Purchase Information
The Purchase Information provides information on how to contact the fund or learn more about it. Here you will find the fund’s telephone number and web address.
Expenses and Fees
Lastly, the Expenses and Fees section of the Evaluator Overview tab shows the fund’s expense ratio (0.86%) as well as the expense ratio for the average fund in its category (0.49%).
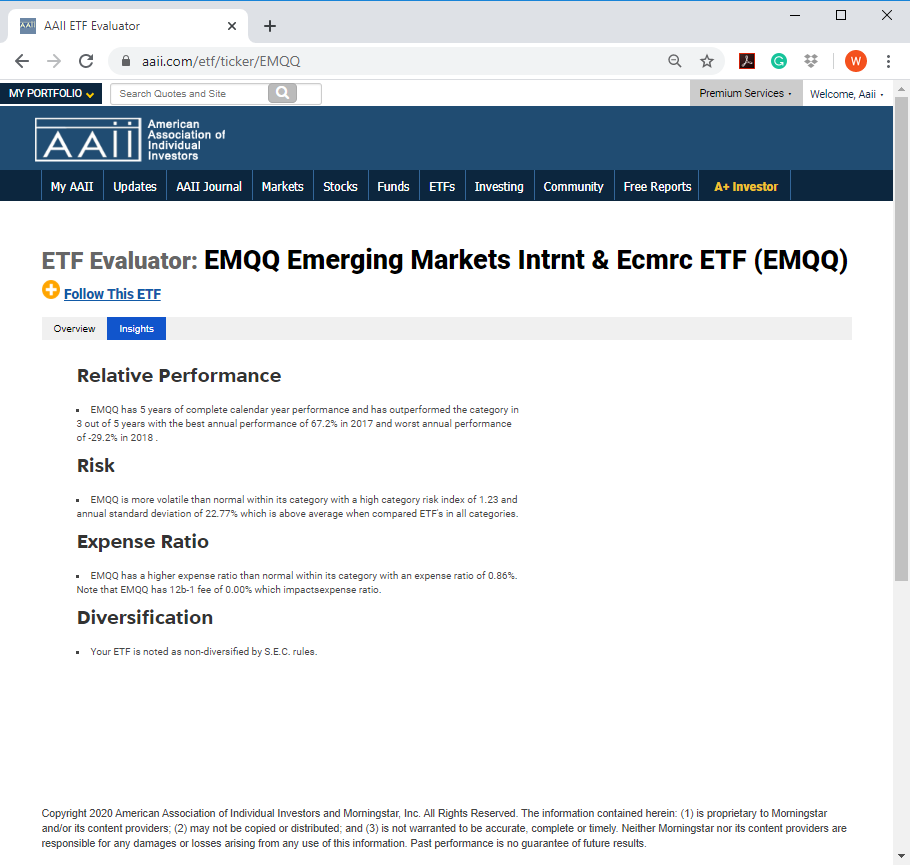
Clicking on the Insights tab gives you a quick qualitative analysis of the fund. It will tell you areas where the fund has fared strongly as well as highlight how consistently it has performed over the past 10 years. It makes getting a quick assessment of a fund easy.
Relative Performance
Over the five years for which EMQQ has full calendar-year performance, the ETF has outperformed its category average in three of those years. Over those five full years, EMQQ’s best year was 2017 when it gained 67.2% and 2018 was its worst year when it lost 29.2%.
Risk
The risk insights indicate whether the selected fund is more or less volatile than the average fund in its category. EMQQ is more volatile than the average fund in the Diversified Emerging Markets category. The fund has a category risk index measure of 1.23 and an annual standard deviation of returns of 22.8%.
Expense Ratio
The expense ratio insights point out whether the fund being analyzed has an expense ratio that is above or below the category average. EMQQ’s expense ratio of 0.86% is higher than the average fund in its category. As an ETF, EMQQ does not have a 12b-1 fee.
Diversification
Per U.S. Securities and Exchange Commission (SEC) guidelines, EMQQ is a non-diversified fund. According to the Investment Company Act of 1940, a diversified investment company cannot hold more than 5% of its assets in a single security and not more than 10% of the securities of a single issuer. Non-diversified investment companies do not have those restrictions.
To start evaluating the mutual funds or ETFs you own, or to investigate a potential new investment, go to AAII.com, enter in a ticker and start evaluating.

