I hope you all had a safe and pleasant holiday weekend. It’s good to be back after a much-enjoyed week off.
I spent last week in Michigan visiting my family and was able to spend a few days fly fishing at the Manistee River in Grayling. Growing up in Michigan, camping “up north” was a large part of my summers. In the early 1980s, we had a Viking pop-up camper and a decade later we had a Shasta travel trailer.
Driving up and down Interstate 75 during the holiday week, we saw even more recreational vehicles (RVs) than usual. Over the last few months, I have seen numerous articles about a spike in people buying “coronavirus campers” as they look for a means to get away without having to fly somewhere or board a cruise ship. This, in turn, has been a boon for publicly traded camping and RV companies, which was hit hard at the start of the coronavirus pandemic.
This past weekend, however, a Wall Street Journal “Heard on the Street” article indicated that this run for RV companies may be coming to end and that investors may want to consider pulling up stakes. The article mentions three stocks specifically: Camping World Holdings Inc. (CWH), Thor Industries Inc. (THO) and Winnebago Industries Inc. (WGO).
According to the Recreational Vehicle Industry Association (RVIA), the RV industry generates in excess of $20 billion in new unit sales annually. The total economic impact of the RV “industry”—including not just sales of new recreational vehicles, but all the manufacturing, sales and service jobs associated with it―is $114 billion annually, according to the 2019 RVs Move America Report from the industry group.
Data from RVIA show that shipments of new recreational vehicles peaked in 2017. While RV sales rose by approximately 30% from 2014 to 2017, RV unit shipments fell in both 2018 and 2019.
Generally speaking, the RV industry is influenced by a number of macroeconomic factors. First, it is extremely sensitive to the overall strength (or weakness) of the economy, given that buying an RV is a large discretionary purchase for most of us. When the economy starts losing steam, RV sales generally fall sharply.
As we have officially entered an economic recession, according to the National Bureau of Economic Research, it probably makes sense that analysts are expecting RV makers and related companies to see a slowdown in sales. This would most likely tap the brakes on some impressive stock gains over the last three months. As of the close on July 2, 2020, here are the 13-week price gains for some key RV companies:
The Wall Street Journal article called this the “summer of the RV” as the latest round of earnings calls point to a number of first-time customers. RVs are even being used as workspaces as companies institute remote work policies in the face of the coronavirus pandemic. Camping World Holdings reported that the first weekend of May “was the biggest weekend in our company’s history, period.”
However, as states begin reopening their economies and people emerge from quarantine, coronavirus cases and hospitalizations are rapidly increasing. If a second round of shutdowns worsens the current economic slump, impacts manufacturing or dampens consumer demand, the sunset could be on the horizon for the latest run-up in RV stocks.
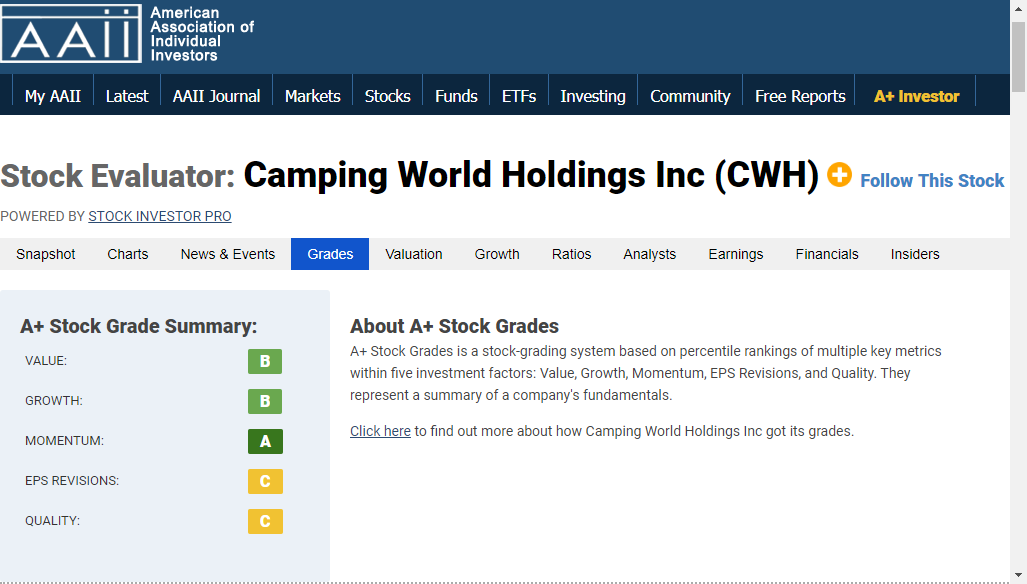
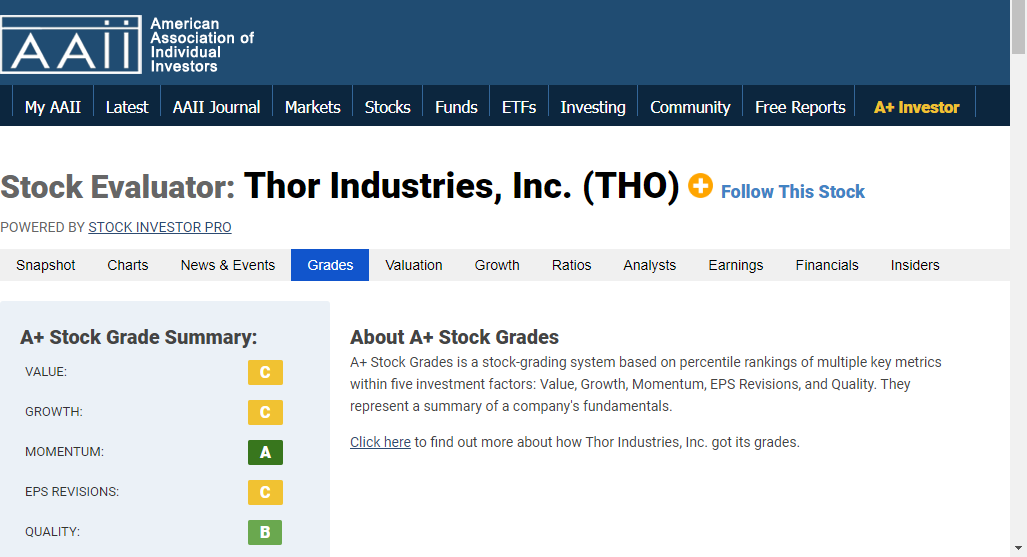
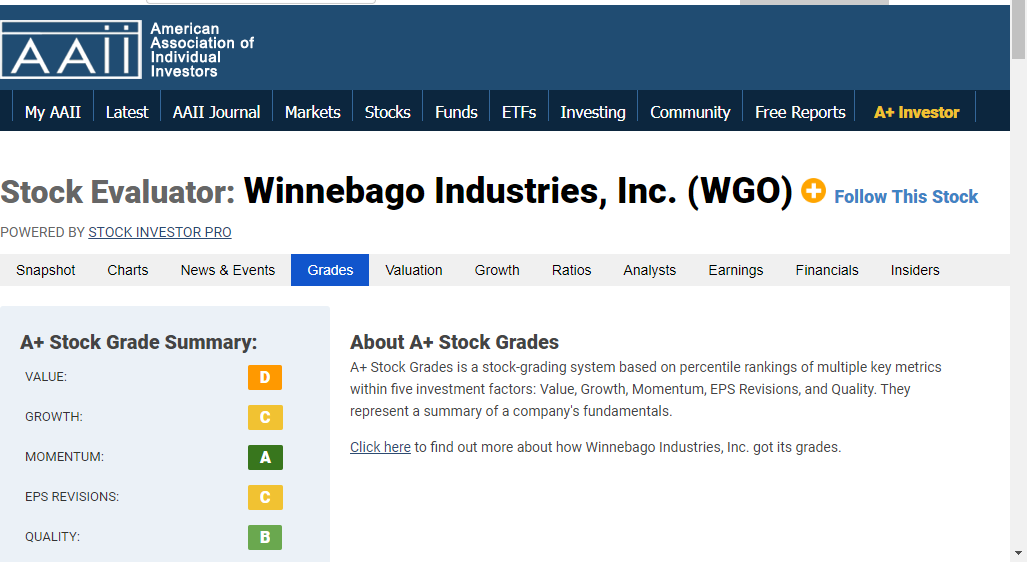
The following images show the A+ Stock Grades for Camping World Holdings, Thor Industries and Winnebago Industries, respectively, as of July 2.
Growth
All three companies saw year-over-year sales declines for their latest quarter compared to the same quarter a year ago. Camping World saw sales decline 3.5% for the quarter ended March 31, 2020, compared to the same quarter the year prior. Both Thor Industries and Winnebago Industries saw sales decline more than 20% compared to the year-ago quarter.
Camping World was the only of the three companies to see an earnings increase for its latest quarter versus one year ago (+58.3%). Winnebago Industries, on the other hand, saw earnings drop by more than 131% for the quarter ended May 30.
The A+ Growth Grade looks at quarterly year-over-year growth in sales, diluted earnings per share from continuing operations and operating cash, as well as annualized growth over the last five years for these three elements.
Camping World has the highest growth grade among the three companies, while the other two have grades of C. However, the growth scores range from 55 for Winnebago Industries to 62 for Camping World.
Momentum
All three companies rate an A when it comes to price momentum―based on the weighted four-quarter relative strength―which gives extra weighting to price performance over the last quarter compared to the other three. Winnebago Industries has a Momentum Score of 89, while Thor Industries is at 91 and Camping World scores a 98.
Estimate Revisions
The A+ Estimate Revisions Grade is based on the magnitude of a company’s last two earnings surprises, using the SUE score and percentage change in the consensus estimate for the current fiscal year over the last month and last three months.
All three companies have a grade of C with their scores ranging from 50 for Camping World to 58 for Thor Industries.
Quality
The A+ Quality Grade is based on how many of the five tests a company passes—management’s use of accruals, asset turnover improvement, buyback yield, dividend growth and earnings estimates. The more tests a company passes, the higher its Quality Grade.
Thor Industries and Winnebago Industries have Quality Grades of B, having passed three of the five quality tests, while Camping World’s is a C after passing only two of the five tests.
Value
The last of the five A+ Stock Grades is value. The Value Grade is the percentile rank of the average of the percentile ranks of six common valuation measures:
Despite its recent price spike, Camping World has a Value Grade of B based on its score of 22. The company does not have positive trailing earnings or positive book value, so its Value Grade is based on four of the six metrics. For these four, it never ranks higher than the 59th percentile (with an enterprise-value-to-EBITDA ratio of 10.6).
Thor Industries has a Value Grade of C derived from its score of 49. It has valid readings for all six metrics, with the ranking ranging from a low of 29 for the price-to-sales ratio (0.72) to 72 for the price-earnings ratio (30.0).
Finally, Winnebago Industries has a Value Grade of D and a score of 66 (remember, the lower the score the better for value). This is the lowest factor grade any of the three stocks received.
Winnebago Industries’ scores for the six underlying metrics range from a low of 37 for the price-to-sales ratio (1.03) to a high of 81 for the price-earnings ratio (41.7), with lower values being preferable for value.
When performing any type of fundamental analysis, it is important to remember that most of the data used is backward facing. The data itself doesn’t necessarily indicate how the company will perform going forward. Instead, it offers a framework on which you can perform objective analysis given the company’s past performance. By making rational assumptions as to the company’s future operating environment and competitive forces, we get an idea of how its future may look and get an idea of whether it is overvalued, undervalued or fairly valued.


