 GPI
GPI
The price-earnings (P/E) ratio is arguably the most popular price multiple used to assess a stock’s valuation compared to others such as the price-to-book-value ratio, price-to-sales ratio and price-to-cash-flow ratio.
There are numerous definitions and variations of the price-earnings ratio. In its simplest form, the price-earnings ratio relates current share price to earnings per share. The higher the ratio, the more investors are paying for each dollar of earnings. For example, if a stock has a price-earnings ratio of 25, it means that investors are paying $25 for each $1 of earnings.
Variations on price-earnings ratios are created by changing the share price used (current or average) and the earnings per share number used (trailing 12 months, expected future earnings, basic versus diluted shares, continuing, etc.).
Trailing 12-Month P/E
Typically, the current price-earnings ratio is calculated by dividing the current stock price by diluted earnings per share from continuing operations for the trailing 12 months (the sum of the last four quarters). Diluted earnings include any securities that may dilute a company’s capital structure, such as stock options and warrants, convertible bonds and convertible preferred stock.
The complication lies in determining what to use for the earnings portion of the price-earnings ratio, and in particular whether to use earnings figures that are backward-looking or forward-looking.
Using the trailing 12-month earnings gives the current value of earnings to investors. However, there is value to looking forward as well.
Forward P/E
The forward (or estimated) price-earnings ratio is based on the current stock price and the estimated earnings for future full fiscal years. Depending on how far out analysts are forecasting annual earnings (typically, for the current year and the next two fiscal years), a company can have multiple forward price-earnings ratios. The forward price-earnings ratio will change as earnings estimates are revised when new information is released, management revises guidance and quarterly earnings are announced.
Also, forward price-earnings ratios are calculated using estimated earnings based on the current fundamentals. A company’s fundamentals could change drastically over a short period of time and estimates may lag the changes as analysts digest the new facts and revise their outlooks.
The forward price-earnings ratio is useful, since the market tends to be forward-looking. The operations of a company today, and the earnings it generates, may be very different than for the company (and its earnings) in the future.
However, there is a significant caveat to mention when it comes to forecasted earnings. Research from the likes of David Dreman and others suggests that analysts do a very poor job of estimating company earnings. As a result, take forward earnings with a grain of salt when using them as a base for investment decisions.
Average P/E
The average price-earnings ratio attempts to smooth out the price-earnings ratio by reducing daily variation caused by stock price movements that may be the result of general volatility in the stock market. Different sources may calculate this figure differently.
A common definition of average price-earnings ratio uses the average of the high and low price-earnings ratios for a given year. The high price-earnings ratio is calculated by dividing the high stock price for the year by the annual earnings per share fully diluted from continuing operations. The low price-earnings ratio for the year is calculated using the low stock price for the year.
A variation on average price-earnings ratio uses the average earnings over a given period of time. This is a method used by Benjamin Graham, where he averaged the earnings of a company over several years. This is especially useful for cyclical firms where earnings vary depending on where they are in the economic cycle and the company’s business cycle. This gives investors an idea of where the current valuation is relative the company’s historical earnings cycle. With this method, however, keep in mind that the farther back you go, the more likely it is that the company, its industry and the economy, have changed over time.
The price-earnings ratio is used to gauge market expectation of future performance. Even when using historical earnings, the current price of a stock is a compilation of the market’s belief in future prospects, encompassing not only future projected earnings, but the assumed growth in earnings moving forward.
Broadly, a high price-earnings ratio means the market believes that the company has strong future growth prospects. A low price-earnings ratio generally means the market has low earnings growth expectations for the firm or there is high risk or uncertainty of the firm actually achieving growth. In other words, a low price-earnings ratio is often a sign that the market is discounting the value of the stock’s future earnings, while a high price-earnings ratio means future earnings are selling at a premium.
However, looking at a price-earnings ratio in isolation may offer limited benefit. It will always be more useful to compare the price-earnings ratios of one company to those of other companies in the same industry and to the market in general.
Furthermore, tracking a stock’s price-earnings ratio over time is useful in determining how the current valuation compares to historical trends.
Below is the Valuation tab from the Group 1 Automotive Inc. (GPI) Stock Evaluator page.
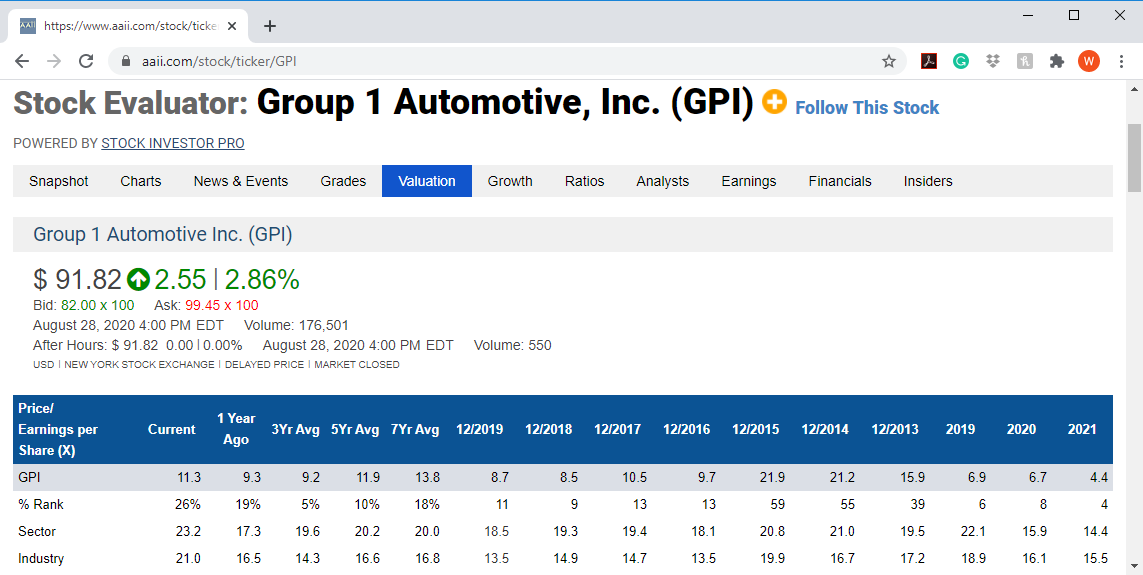
The Valuation section of the Stock Evaluator contains a wealth of information to help you perform time series analysis of a company’s valuations and compare these figures against the stock universe and the company’s sector and industry. You can also see forward price-earnings ratios based on the consensus earnings estimate for the company’s current fiscal year and next fiscal year.
As of the close on August 27 (the data is through the previous trading day’s close), Group 1 Automotive had a trailing price-earnings ratio of 11.3. This is up from 9.3 one year ago. The current price-earnings ratio of 11.3 for Group 1 Automotive ranks in the bottom 26% of all U.S.-traded stocks.
At the far-right of the table we see the forward price-earnings ratios for 2020 and 2021. These ratios are based on the current price of Group 1 Automotive shares and the consensus earnings estimate for fiscal 2020 and fiscal 2021. Based on the consensus estimate for the current fiscal year, Group 1 Automotive’s forward price-earnings ratio is 6.7 while the consensus estimate for next year translates into a forward price-earnings ratio of only 4.4.
A forward price-earnings ratio that is lower than the current price-earnings ratio points to expectations of future growth, all else equal. This is confirmed in Group 1 Automotive by its estimated earnings of $12.93 for the fiscal year ending December 2020, versus its trailing 12-month earnings of $7.87 per share.
It is also important to look at trends over time. We can see the trend in average price-earnings ratio, based on the high and low price for the year and the corresponding earnings per share figure for the year, over the last seven years. Since 2013, Group 1 Automotive’s average price-earnings has ranged from a high of 21.9 in 2015 to a low of 8.5 in 2018.
The Valuation section also shows the three-, five- and seven-year averages (when available). Group 1 Automotive’s current trailing price-earnings ratio of 11.3 is above its three-year average price-earnings of 9.2. However, the trailing price-earnings ratio is below the five- and seven-year averages of 11.9 and 13.8, respectively.
For the most part, Group 1 Automotive shares are trading at a lower price-earnings ratio than they have historically. A lower-than-average price-earnings ratio can mean many things. The market may have lower expectations for earnings growth going forward. However, it could also point to an undervalued stock. A trend analysis using average price-earnings ratios is more useful when you have a long history of data. To bring the price-earnings ratio closer to its long-term average rate, earnings per share would have to rise or the stock price would have to fall.
The price-earnings ratio is particularly useful when comparing stocks in the same sector or industry. For example, high-growth firms such as technology companies often have higher price-earnings ratios, whereas utilities, which typically have fewer growth prospects, often have lower price-earnings ratios. If a stock’s price-earnings ratio is much lower than that of a competitor, it suggests that the market is less confident of the company’s prospects relative to its peers.
Group 1 Automotive’s trailing price-earnings ratio is less than half that of the median price-earnings ratio of 23.2 for its sector (consumer cyclicals) and is nearly half that of the typical stock in the auto vehicles, parts and services retailers industry (21.0). [Editor’s note: Sector and industry classifications used are assigned by Thomson Reuters Business Classifications (TRBC).]
The usefulness of any price-earnings ratio is limited to firms that have positive actual and expected earnings. Depending on the data source you use, companies with negative earnings will have a “null” value for a price-earnings ratio while other sources will report a price-earnings ratio of zero.
In addition, earnings are subject to management assumptions and manipulation more than other income statement items such as sales, making it hard to get a true sense of value. Even though a company is reporting earnings that follow generally accepted accounting principles (GAAP), management often has tremendous latitude when it comes to recognizing revenue, deferring expenses, etc., which can have a significant impact on the earnings it reports.
A company’s price-earnings ratio is a useful tool for examining a firm’s share price versus its earnings. As with most fundamental analysis, it is important to understand the elements that go into calculating the ratios. To use price-earnings ratios in a meaningful way, they must be compared to a company’s ratios over time or between industries and similar competitors.

