Last week’s Making the Grade email outlined some new enhancements we made to the A+ Stock Grades Screener that allow A+ Investor subscribers to filter against specific groups of companies—user portfolios, passing company lists from the AAII Stock Screens and specific sectors or industries. To read last week’s article, click this link.
This week, I am challenging you to use these new features. Specifically, identify one “value on the move” stock—B or better for both Value and Momentum Grade—from one of your favorite AAII Stock Screens that you would consider tracking. Then, pass along your investment thesis about that stock to us. The following walks through an example of how to do this using the Stock Grades Screener to run a screen and the Stock Evaluator to examine a chosen stock’s fundamental data and grades in order to summarize its prospects.
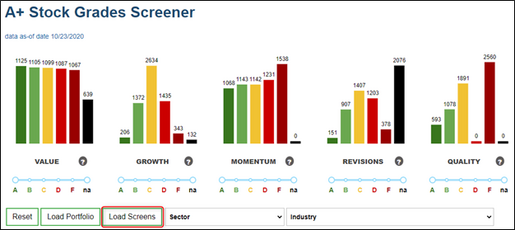
With the A+ Stock Grades Screener, you can identify stocks with particular letter grades across the A+ ratings on value, growth, momentum, estimate revisions and quality factors. To access the A+ Investor grades screener for stocks, go to www.aaii.com/stockideas/quant.
One of the recent enhancements we have made to the Stock Grades Screener is the ability to filter the companies passing any of AAII’s Stock Screens. You can run these filters against the latest set of passing companies as of the close of the previous trading day.
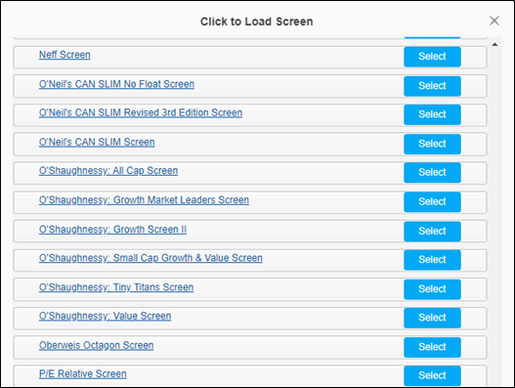
So, for example, by clicking the Load Screens button, I am presented with the list of AAII Stock Screens (the image below is only a subset of the 60+ screening strategies AAII tracks):
Clicking the blue Select button next to Neff screen loads the 18 companies that passed the AAII Neff screen as of October 23. Here they are:
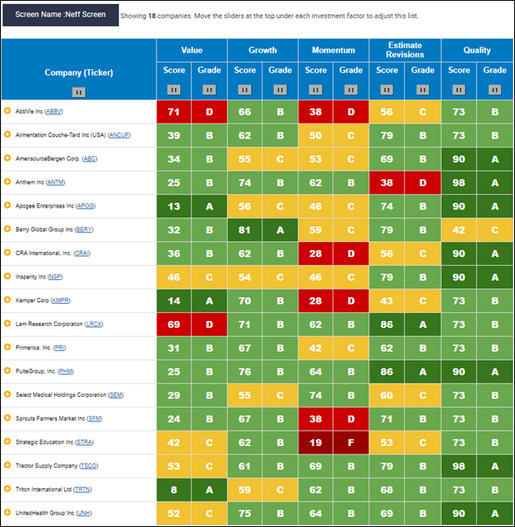
While the Neff screen is what some may call a “growth at a reasonable price screen,” in that its primary filter is the dividend-adjusted PEG ratio, it only uses one value metric. The A+ Value Grade is a composite of several value measures: price to sales, price to earnings, enterprise value to EBITDA (EV/EBITDA), shareholder yield, price to book and price to free cash flow.
Requiring these 18 companies to have a Value Grade of B or better captures stocks passing the Neff screen that perhaps have more true value. Adjusting the Value slide so that the minimum Value Grade is B or better leaves me with 11 remaining companies.
For value investors, the sweet spot in investing is being able to buy an undervalued stock right before its value is recognized by the market and just before its stock price begins to take off.
But how can a value investor tell when a stock is in the sweet spot? The answer, according to Brian Nelson, president of investment research company Valuentum Securities, is to identify stocks with good value that are just starting to exhibit good technical/momentum characteristics.
Doing so helps an investor to avoid:
Several research studies—most notably a study done by Cliff Asness of AQR Capital, Tobias Moskowitz of the University of Chicago and Lasse H. Pedersen at the New York University in their paper “Value and Momentum Everywhere”—make the argument that value and momentum strategies work well together. In their research, Asness et al. show that over time combining value and momentum strategies across diverse markets and asset classes results in significantly higher risk-adjusted rates of return.
To that end, I adjusted the slider for the Momentum Grade so that only those stocks passing the Neff screen with Momentum Grades of B or better remain, leaving four companies.
Lastly, I narrowed my search to those companies with a Quality Grade of B or better as well as C or better grades for Growth and Estimate Revisions. For your challenge you can add other grade filters or not, depending on your investing style and how many stocks remain to choose from.
In all, three of the companies passing AAII John Neff screen as of October 23, 2020, meet my A+ Stock Grades filters:
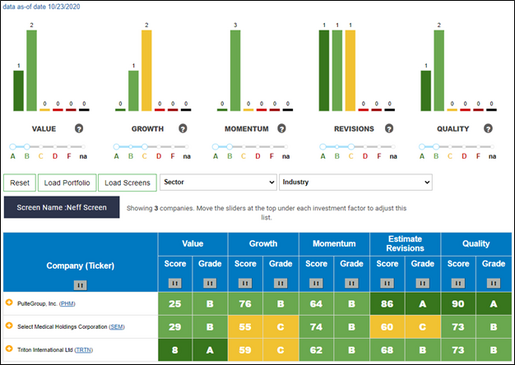
From this list, I selected the stock that I was least familiar with: Select Medical Holdings Corp. (SEM).
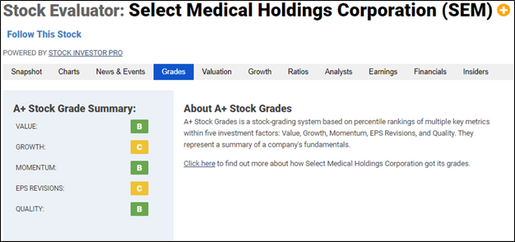
As of the close on October 23, 2020, Select Medical had the following A+ Stock Grades:
Select Medical is an operator of specialty hospitals, outpatient rehabilitation clinics and occupational medicine centers in the U.S. Its specialty hospitals segment consists of hospitals designed to serve the needs of long-term acute patients and hospitals designed to serve patients that require intensive medical rehabilitation care. The outpatient rehabilitation segment consists of clinics that provide physical, occupational and speech rehabilitation services. The Concentra segment consists of medical centers and contract services provided at employer worksites and Department of Veterans Affairs community-based outpatient clinics (CBOCs) that deliver occupational medicine, physical therapy, veteran’s health care and consumer health services.
[For your own company analysis, you can grab the company description from the stock’s Evaluator page, accessed by typing the name or ticker in the search tool. Your analysis should continue by examining the Grades tab of the Evaluator.]
Select Medical rated highly in Value, Momentum and Quality but had average grades for Growth and Estimate Revisions.
Since value is one of the cornerstones of my selection process, I can use the Grades page of the Stock Evaluator to take a closer look at the underlying variables that contribute to the overall Value Grade:
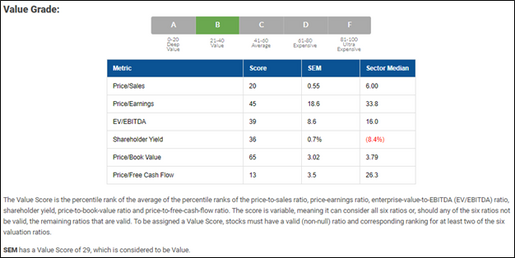
As mentioned above, the A+ Value Grade is based on six valuation multiples: price to sales, price to earnings, enterprise value to EBITDA, shareholder yield, price to book and price to free cash flow. It takes the average of the percentile ranks for each of these variables, and then generates a percentile ranking of that average. The company has extremely attractive price-to-free-cash-flow and price-to-sales ratios (cheapest 13% and cheapest 20%, respectively), while its price-to-book ratio rank is less attractive to value investors, ranking in the top 35% off all U.S.-listed stocks.
The company reported a 2,135% positive earnings surprise on July 30. Since that announcement, the company has seen its consensus estimate for the current fiscal year rise 8.4% on one upward revision and one downward revision. [This data is available on the Snapshot tab of the Stock Evaluator.]
Over the last five years, Select Medical has seen its revenue by grow 12.2% a year, on average. Over the same period, earnings have been growing by 4.0% a year. Three analysts are projecting earnings to grow by an average of 16.3% a year over the next three to five years.
Select Medical’s return on equity (ROE) has risen to 19.5% from 14.9% in 2013, much better than the median ROE of 8.8% for the companies in the health care facilities and services industry. This increase in ROE, however, appears to be driven primarily by increasing its debt load. The company’s liabilities to assets ratio stands at 86.7%, rising from 72.1%, well above the median for its industry (8.8%).
Select Medical shares have been relatively strong over the last year, gaining 32.9%. This ranks in the top 23% of all U.S. listed stocks. Just in the last four weeks, the stock is up almost 17%, reaching a new all-time low.
Please take some time to use the A+ Stock Grades Screener to uncover a “value on the move” stock from one of your favorite AAII Stock Screens. Analyze it using the Stock Evaluator tabs. Then pass along your analysis to me at wayne@aaii.com.
I look forward to reading your analysis and highlighting your submissions in a couple of weeks.

