Welcome to Thanksgiving 2020 week. This year has been one of the more unique years many of us have ever seen, and we still have a little over a month to go.
This week the U.S. stock markets are open for three and a half days. They are closed on Thursday for Thanksgiving and open for a half-day session on Friday.
Many of us probably aren’t thinking about stocks this week. About the time you are reading this, I’ll be picking up my curbside grocery order in my hometown in Michigan, and I am sure many more of you are planning out your shopping lists for Thursday’s feast.
Others are undoubtedly looking to see what Black Friday and Cyber Monday deals retailers will be offering this holiday season. While the coronavirus pandemic has disrupted the traditional holiday “deal season,” especially with many states once again limiting the number of people in retail stores at one time, online deals will still abound over the next several days.
It is also that time of year where we see a veritable cornucopia of articles talking about the “best stocks” to own heading into the holiday shopping season. So, I felt it only appropriate to add to the bounty.
I am a regular reader of Schaeffer’s Investment Research, especially articles from its senior quantitative analyst, Rocky White. Last week he put out some interesting historical data regarding stock market performance during Thanksgiving week.
According to White’s research, Thanksgiving week tends to be bullish. Over the last 50 years, according to Schaeffer’s, the S&P 500 index has gained an average of 0.59% during the week. Furthermore, Thanksgiving week has ended with a gain 70% of the time. All other weeks over that 50-year period had an average gain of 0.16% and have been up 56% of the time.
White also presents S&P “sector” performance during Thanksgiving week over the last 10 years (he calls them sectors, but the names do not match the designations S&P uses). During Thanksgiving week, the top three sectors over the last decade have been personal goods, travel & leisure and general retailers. However, White points out that these are three segments of the economy are driven these days by coronavirus-related news.
On the flip side, the worst sectors during Thanksgiving week over the last decade have been oil stocks—oil & gas producers and oil equipment & distribution, utilities and banking stocks.
As a long-term investor, this information is more for entertainment value. However, White also provides a list of the individual S&P 500 stocks that have performed the best during the week of Thanksgiving over the last 10 years and the weakest stocks during turkey week. These complete lists are available to everyone by following the link to the article I provided above.
I took the list of the top 25 tickers during Thanksgiving week over the past 10 years and created a portfolio using My Portfolio. I then used a recent enhancement to the A+ Stock Grades Screener to load that portfolio and perform some additional manipulation.
The image below shows the distribution of the A+ Stock Grades for the 25 stocks that White identified as the top Thanksgiving-week performers over the past 10 years:
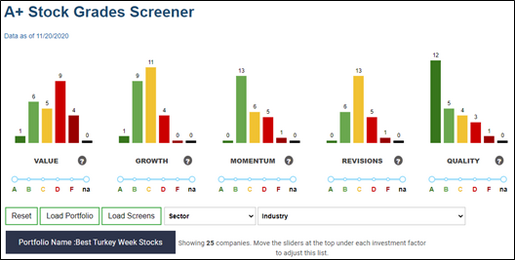
Based on these distributions, I can make some general observations about this group of stocks.
First, they tend to skew toward higher valuations (with higher value scores indicating richer valuations and lower Value Grades). Only one of the 25 stocks in this group has an Value Grade of A as of the close on November 20: Universal Health Services Inc. (UHS). According to White’s research, Universal Health Services has posted an average Thanksgiving week gain of 0.96% over the last 10 years and has posted a gain the week of Thanksgiving 80% of the time. The company owns and operates acute care hospital and outpatient facilities as well as behavioral health care facilities. United Health Services ranks in the bottom 30% for five of the six variables used to calculate the Value Grade, with the exception being its price-to-book-value ratio, where it ranks in the bottom 50% among all U.S.-listed stocks.
Four of these 25 companies have Value Grades of F, including Amazon.com Inc. (AMZN), a company that is usually part of any retail conversation. White indicates that Amazon has gained in eight of the last 10 Thanksgiving weeks and has posted an average gain of 2.0%. Amazon ranks in the top 10% for two of the six metrics used for the Value Grade—price-earnings ratio (91%) and price-to-book ratio (94%)—and in the top 15% for enterprise-value-to-EBITDA ratio (88%) and price-to-free-cash-flow ratio (88%). Reminder: For the Value Grade, higher ranks translate into higher valuation, which from a value investor standpoint is not attractive.
Looking at the distribution of Growth Grades, these top Thanksgiving-week stocks tend to have average or above-average growth. However, again, only one of them has a Growth Grade of A: Amazon. Of the six variables used to calculate the Growth Grade, Amazon ranks in the top 15% for five of them. The company’s quarterly year-over-year growth in operating cash flow, which is 51.6%, ranks in the top 26% of all U.S.-listed companies.
The 25 top Thanksgiving-week stocks over the last 10 years are exhibiting above-average price momentum. Interestingly, however, none of these companies have an Momentum Grade of A. However, 13 of the 25 have B grades and General Motors Co. (GM) has the highest momentum score at 80. General Motors has posted a Thanksgiving-week gain in eight of the past 10 years and an average gain of 1.27%. Over the last 52 weeks, General Motors shares have outperformed the S&P 500 by almost nine percentage points, but over the last four weeks that outperformance has grown to nearly 15 percentage points.
Only one of the 25 companies we are reviewing has an Momentum Grade of F: United Airlines Holdings Inc. (UAL). United Airlines shares have been up 80% of the Thanksgiving weeks over the past decade, while the stock’s average gain has been 1.75%. Airline stocks, in general, have been hit especially hard by the shutdowns that have occurred due to the coronavirus pandemic. Airlines with a significant international presence, such as United, have faced even greater struggles. Over the 52 weeks ending November 20, United Airlines shares have fallen more than 56%, underperforming the S&P 500 by more than 61 percentage points. Over the last four weeks, however, United Airlines shares have risen nearly 13%, outperforming the S&P 500 by almost eight percentage points.
When reviewing the Estimate Revisions Grade distribution for these 25 companies, we see an almost perfect bell curve, with the same number of firms seeing above-average and below-average estimate revisions scores. None of these firms has an Revisions Grade of A, but Amazon has the highest overall Revisions Score of 78. The company has reported earnings surprises that rank in the top 20% and top 6% for the last two quarters, respectively. Also, Amazon’s consensus estimate for the current fiscal year ending December 31 has risen 9.8% over the last month and 11.2% over the last three months, ranking in the 71st and 67th percentiles, respectively.
One of these 25 top Thanksgiving-week performers over the last 10 years has an Revisions Grade of F: SBA Communications Corp. (SBAC), which is a real estate investment trust (REIT). SBA Communications has posted a gain during Thanksgiving week 80% of the time over the past decade with an average gain of 0.87%. The company is an independent owner and operator of wireless communications tower structures, rooftops and other structures that support antennas used for wireless communications. The company’s primary business line is its site leasing business, whereby it leases antenna space to wireless service providers on towers that it owns or operates, and manages rooftop and tower sites for property owners under various contractual arrangements. The company owns approximately 25,460 towers and it manages or leases approximately 5,500 actual or potential towers.
SBA Communications has reported earnings surprises that rank in the bottom 3% and bottom 15%, respectively, for the last two fiscal quarters. Over the last three months, the 13 analysts providing an earnings estimate for the current fiscal year ending in December have revised their estimate downward 14 times, lowering the mean estimate by 490%. Over the past month, the current fiscal quarter’s consensus estimate has fallen by nearly 640%.
Lastly, looking at the Quality Grades for these 25 companies, they tilt overwhelmingly toward high quality. Nearly half—12 of the 25 companies—have Quality Grades of A. Two companies have the highest Quality Score possible (99)—Old Dominion Freight Line Inc. (ODFL) and Monster Beverage Corp. (MNST).
Old Dominion ranks in the top 12% or better for five of the eight variables used to arrive at the overall Quality Grade and ranks in the 53rd percentile or better for all eight metrics. Monster Beverage ranks in the top 14% or better for five of the eight Quality Grade metrics.
Only four of the 25 have below-average Quality Grades, and only one company—United Airlines—has a Quality Grade of F. United Airlines doesn’t rank any higher than the 49th percentile for the seven variables used to calculate a Quality Score that it has valid values for.
The holiday season is upon us once again, and I am headed to Michigan next week for a socially distanced Thanksgiving with my mother and sister.
We will be off next week but will return on Monday, December 7.
No matter what your Thanksgiving plans are, may they be filled with happiness and, above all, good health.


