Investors poured a record amount of money into exchange-traded funds (ETFs) in 2020. Data from ETF.com shows that investors added the largest sum ever to ETFs during 2020: $507.4 billion flowed into U.S.-listed ETFs during the year, topping the previous record of $476.1 billion from 2017. Annual inflows for 2020 were also 55% greater than the $326.3 billion registered in 2019. Morningstar reported that ETFs took in a record $499 billion in net flows in 2020 and at the end of the year held just under $5.5 trillion of investors’ money.
The majority of ETFs are passively managed, meaning they track an index. However, there is a growing number of ETFs that are actively managed.
Active ETFs have been in the news a lot recently, namely because of the stunning rise and recent volatility of the ARK Innovation ETF (ARKK). The fund’s broad exposure to disruptive innovation generated an eye-popping 151.3% return based on net asset value (NAV) in 2020. The ETF has struggled in 2021, however, with a 5.1% loss in February and a year-to-date return of 4.8% through the end of February.
But what exactly is an active ETF? And how are they different from passive ETFs?
Last month I provided an overview of ETFs. ETFs are hybrid investment vehicles that can offer relatively low-cost and tax-efficient exposure to a variety of asset classes and investment strategies. Like traditional mutual funds, most ETFs invest in a diversified portfolio of stocks and bonds. However, ETFs differ from traditional mutual funds in that they trade on a stock exchange.
Active ETFs were first introduced by Bear Stearns in 2008. They are run by fund managers who pick stocks and/or bonds in an effort to beat the market. Like passive ETFs, active ETFs also have benchmarks. But active ETFs are trying to beat that benchmark through active security selection, sector allocation, etc.
Active ETFs currently play a minor role in the overall ETF market. There are 500-plus actively managed ETFs in the U.S., according to Morningstar, and they accounted for about $193 billion in assets under management as of January 2021. To put this into context, that is less than one-fifth of the overall number of ETFs and just 3.5% or so of the trillions of dollars that are invested in ETFs, according to Morningstar.
However, active ETFs are growing rapidly and there are many newcomers in the active ETF market: Fidelity launched active ETFs that mimic its flagship strategies, Capital Group is launching its own active ETFs and Dimensional Fund Advisors will convert six of its mutual funds into active ETFs later this year.
But among all active ETF players, Cathie Wood and her team at the ARK family of funds stand above the rest. All five active ARK ETFs delivered gains in excess of 100% in 2020 and accounted for 40% of new active ETF money in the 12-month period ended in January.
One of the catalysts behind the recent surge in active ETFs is their ease of access. If you want to invest in an actively managed product, mutual funds and ETFs are your two primary options. While both vehicles might take similar investing approaches, their barriers to entry are vastly different. Actively managed mutual funds usually require a minimum investment and sometimes that minimum investment hurdle may be too high for an investor.
Active ETFs, on the other hand, do not have investment minimums. The ARK Innovation ETF closed at $122.36 on Friday, March 19, a much more accessible price point for investors. On top of this, many brokerages have implemented commission-free trading, making ETFs affordable and accessible options.
In addition, active ETFs often fare better than mutual funds when it comes to taxes. Mutual fund managers may have to sell shares to meet redemptions, triggering capital gains for investors who remain behind. ETFs, however, are structured differently.
ETFs can send securities out of the portfolio in kind without actually selling them in order to meet redemption requests. This means they tend to be much more tax-efficient relative to mutual funds, which often have to sell down positions to meet shareholder redemptions. This structure makes ETFs more tax-efficient than mutual funds.
A compelling argument in favor of mutual funds, however, is that they can close to new investors to preserve their strategies while ETFs cannot. Why does that matter? When asset managers think a particular fund or strategy has reached its capacity, it can stop or slow new money from coming in by closing the fund to all investors or to a particular group of investors.
ETF managers, in contrast, don’t have that luxury. They still have to add new investment dollars to positions that may have appreciated in value and no longer offer compelling valuations. Alternatively, managers may allocate new investment dollars to their next-best ideas, which could also risk diminishing the efficacy of their strategy, thereby hurting their performance.
As an A+ Investor subscriber, you can use the ETF+ Screener to identify active ETFs.
As an example screen, we looked for ETFs in the Equity Global Asset Class. In addition, we excluded index funds.
With data as of the end of February, there are 241 out of the 2,491 A+ Investor ETF universe that match these criteria.
To avoid ETFs that may be on the verge of closing, we also required that emerging market ETFs have at least $100 million in total assets, leaving us with 53.
Shifting to performance, we further narrowed down this universe to look for funds that outperformed 80% of their category peers based on NAV returns over a three- and five-year basis. This reduced the universe of active equity ETFs to six:
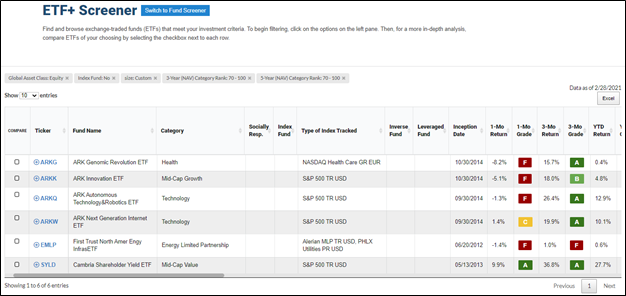
Given last year’s extraordinary returns for the ARK family of ETFs, it isn’t surprising that four of them appear on this list.
The ARK ETFs hold the top four slots in terms of five-year performance, with the ARK Next Generation Internet ETF (ARKW) at the top with an average annual return of 58.1%.
Keep in mind that the return filters with the ETF screener are based on relative returns compared to the other ETFs in a respective category. That’s why the First Trust North American Energy Infrastructure ETF (EMLP) also appears in this listing with its average five-year return of 4.7%. The average annual return for the energy limited partnership category over the past five years is 0.5%.
Looking at short-term performance turns this list upside down. Year to date through the end of February, the Cambria Shareholder Yield ETF (SYLD) has posted a 27.7% return, putting it on top.
The performance grades provided indicate how an ETF rates relative to its category peers. All ETFs on this list except the First Trust Energy ETF have five-year performance grades of A, with the First Trust Energy ETF receiving a B. However, all six of the ETFs receive A grades for their three-year performance.
Year to date, only the Cambria Shareholder Yield and the ARK Autonomous Technology & Robotics ETF (ARKQ) have A grades. The ARK Genomic Revolution ETF (ARKG) and the ARK Innovation ETF have D grades for their 2021 performance and the First Trust Energy ETF has an F grade.
Active ETFs can be great choices for investors who want to pursue active management. However, active management doesn’t necessarily mean higher returns over longer periods of time. Furthermore, active ETFs generally charge higher fees than their passive counterparts. This means investors have to pay more for active management regardless of the fund’s performance.


