The A+ Stock Grades system is a grading tool based on percentile rankings of multiple key metrics within five investment factors: value, growth, momentum, earnings estimate revisions and quality. They represent a summary of a company’s fundamentals and give you a quick overview of how a stock rates based on the five investment factors that have been shown to produce market-beating results.
Not only do you get a letter grade for each of the five investment factors, but you can also see the percentile rankings of the underlying data points for each grade. Also, we provide a list of the company’s competitors and their letter grades. These grades are calculated and updated daily.
While you can review the A+ Stock Grades for specific companies, with the A+ Stock Grades Screener—an exclusive benefit of your A+ Investor subscription—you can also identify stocks with particular letter grades across the A+ rankings on value, growth, momentum, estimate revisions and quality factors. To access the A+ Investor Grades Screener for stocks, go to www.aaii.com/stockideas/quant.
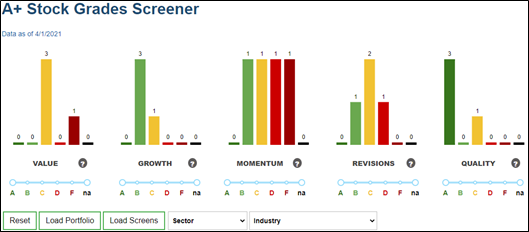
At the top of the A+ Stock Grades Screener page, histograms (bar graphs) show the stock universe’s distribution across the letter grades for each of the five A+ factors.
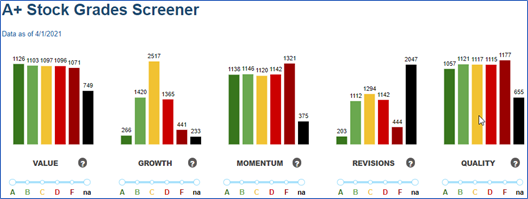
Furthermore, when you first visit the Grades Screener page, there is a table listing all of the companies in the A+ Investor stock universe (roughly 6,200 companies):
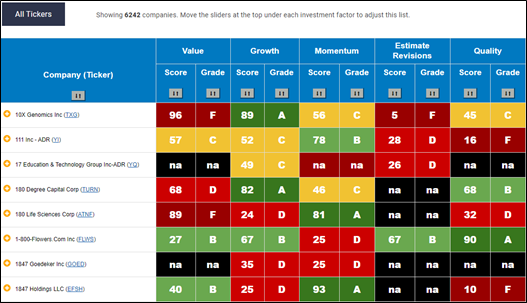
You can sort this table based on the company name and the grade or raw score for each of the five factor grades. You can toggle between ascending and descending order for any column by clicking on the up/down arrow icon in the column heading.
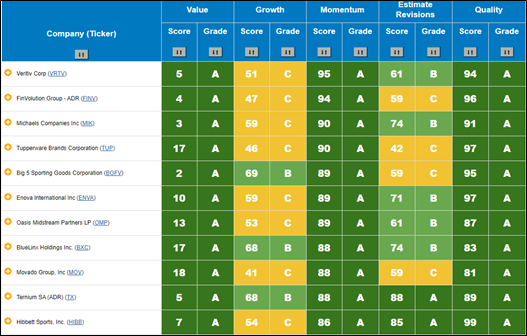
Let’s say, for example, you wanted to isolate only those stocks with value, momentum and quality grades of A and estimate revisions and growth grades of C or better:

With data as of the close on April 1, 2021, 16 companies met these parameters. Here is a subset of those companies, ranked in descending order by Momentum Score:
A+ Investor subscribers can also filter against specific groups of companies—user portfolios, passing company lists from the AAII Stock Screens and specific sectors or industries:
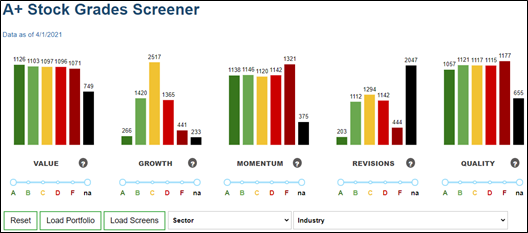
You can see drop-down menus at the bottom of the image above where you can select portfolios, screens and a specific sector or industry.
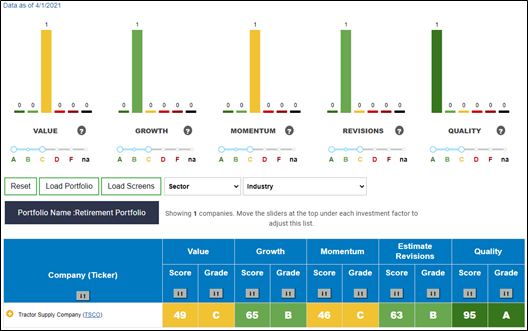
If you want to see the grades of the stock holdings in a portfolio you have created using the My Portfolio tool, click the Load Portfolio button. This will bring up a list of all the portfolios you have created with the My Portfolio tool. Click the blue Select button for the portfolio you wish to analyze and the stocks in that portfolio will be loaded into the data table. Here, we have loaded the portfolio called “Retirement Portfolio,” which has four stock tickers:
Not only can you see the grades and scores for the five Stock Grades factors, but you can filter these tickers based on their various A+ Stock Grades. If you were interested to see how many of these four stocks have A+ Stock Grades of C or better, you would discover that only one—Tractor Supply Co. (TSCO)—meets these requirements:
A+ Investor subscribers can also filter the companies passing any of AAII’s Stock Screens. You can run these filters against the latest set of passing companies as of the close of the previous trading day.
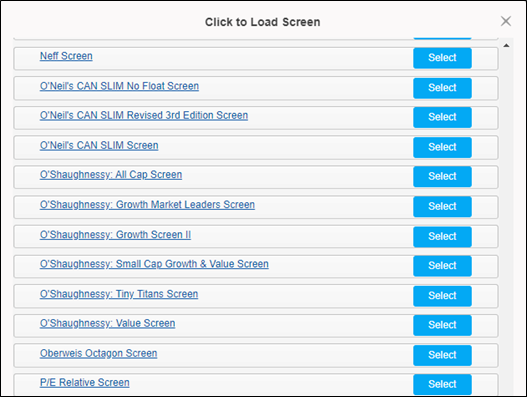
So, for example, by clicking the Load Screens button, you can select the John Neff screen. But first, you need to reset the companies you’re analyzing, so click the Reset button. Doing so “unloads” any portfolio, screen passing companies and sector/industry combination, as well as any grade filters you may have set up previously. Clicking Reset will return you to the full universe of stocks in the A+ Investor database.
After clicking Reset and selecting Load Screens, you are presented with the list of AAII Stock Screens (the image below is only a subset of the 60+ screening strategies AAII tracks):
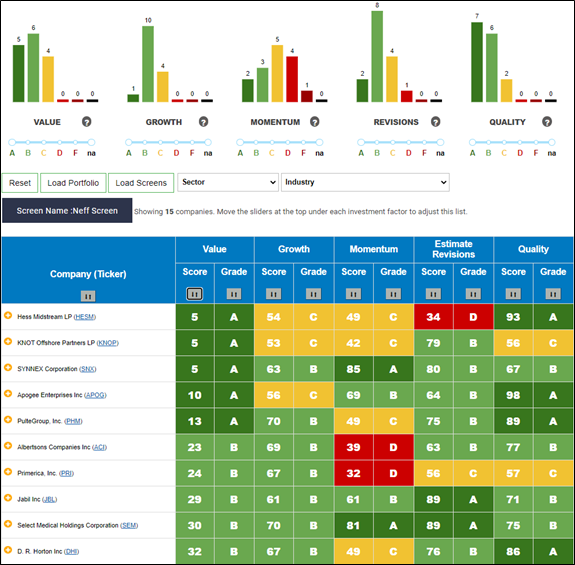
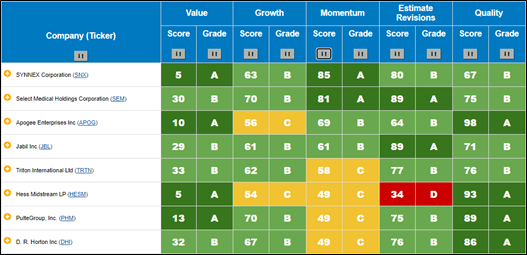
Clicking the blue Select button next to Neff Screen loads the 15 companies that passed the AAII Neff screen as of April 1. Here are 10 of those stocks with the lowest Value Scores:
While the Neff screen is what some may call a “growth at a reasonable price screen,” in that its primary filter is the dividend-adjusted PEG ratio, it only filters on one value metric. The A+ Value Grade is a composite of several value measures: price to sales, price to earnings, enterprise value to EBITDA (EV/EBITDA), shareholder yield, price to book and price to free cash flow.
So, to capture stocks passing the Neff screen that perhaps have more true value, we adjusted the Value filter to only allow those passing tickers with a Value Grade of B or better. We are also interested in stocks exhibiting at least average price momentum, so we adjusted the Momentum Grade filter to only allow those passing companies with Momentum Grades of C or better. Lastly, we required that the Quality Grade be at least a B, leaving us with eight of the original 20 Neff passing stocks as of April 1. Here are the eight companies, this time ranked in descending order by their Momentum Score:
As an A+ Investor subscriber, you can also run Stock Grade screens against companies in a specific sector and/or industry using the Sector and Industry drop-down menus on the Grades Screener page.
Let’s start with technology stocks (but first, we clicked the Reset button to start fresh).
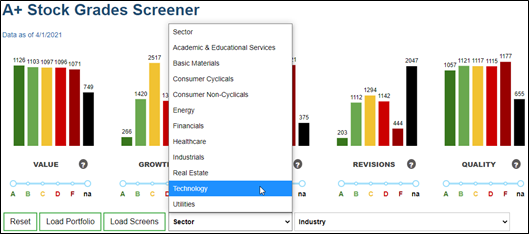
As of April 1, 2021, 1,025 stocks in the A+ Investor stock universe were designated as being in the technology sector by The Refinitiv Business Classifications (TRBC).
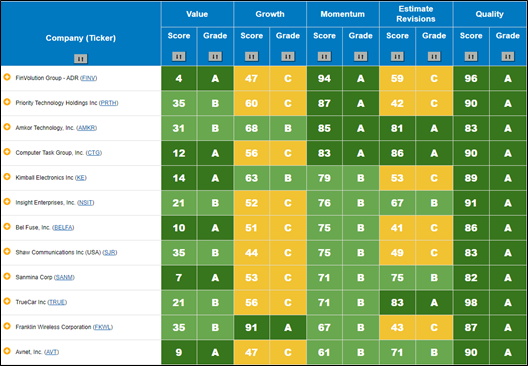
To avoid overly frothy valuations in this sector, we first required a Value Grade of B or better. This quickly cut the number of companies down to 208, with data as of April 1. Being interested in “value on the move” stocks, we also required that the Momentum Grade be B or better, leaving 44 companies. To isolate high-quality companies, we also required a Quality Grade of A or better, which left 20 companies. Lastly, we required average-or-better Growth and Revisions Grades. These filters reduced the technology stock universe to 12 companies from the initial 1,025. Here is that list sorted in descending order by Momentum Score:
If you wanted to narrow the analysis within the technology sector, you can also select an industry within that sector from the Industry drop-down menu.

