The A+ Investor mutual fund and exchange-traded fund (ETF) universes track more than 24,000 and 2,600 tickers, respectively. For the average investor, these universes are too large to realistically evaluate.
With A+ Investor, however, you have access to a variety of tools to help you perform a side-by-side analysis of mutual funds and ETFs, as well as narrow down these universes into more manageable subsets for further research and analysis. These tools are located on the A+ Investor dashboard, found at the far right of the main navigation bar at AAII.com.
For both mutual funds and ETFs, A+ Investor provides grades for a variety of data points, including:
The image below is a snapshot from the Fund Evaluator for the Vanguard 500 Index Investor fund (VFINX).
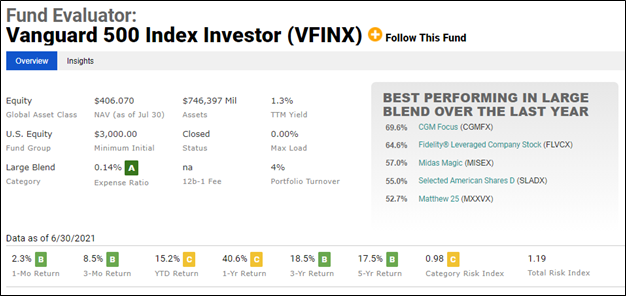
Here you see a variety of letter grades for several data points.
As of June 30, 2021, the fund had an expense ratio of 0.14%. Compared to other funds in the U.S. equity large blend mutual fund category, the Vanguard 500 Index fund ranked in the bottom 20%, with a lower expense ratio being more desirable. As a result, the fund has an expense ratio grade of A.
Looking at the returns for the Vanguard 500 Index fund, it generated a one-year return of 40.6% through the end of June. While, on an absolute basis, this is nothing to sneeze at, the fund was only in the middle of the pack among large blend mutual funds, which accounts for its C grade.
Lastly is the category risk index grade. The category risk for a fund compares the standard deviation of monthly returns for the fund, in this case the Vanguard 500 Index fund, to the standard deviation of monthly returns for the typical fund in the category, in this case the large blend category.
The Vanguard 500 Index fund had a standard deviation of 18.5% at the end of June. This was 2% lower than that of the typical fund in the large blend category, thus its “raw” score of 0.98. Compared to the risk index scores of all other funds in the large blend category, the Vanguard 500 Index fund once again falls in the middle, receiving a grade of C.
Comparing funds and ETFs to their category peers presents some unique challenges worth pointing out.
When looking at the performance grades for a mutual fund or ETF, remember that the grades are based on how the fund compared to its peers within the category, not the overall market.
Let’s say you are looking for mutual funds with high grades based on their three-year annualized return. You may come across a fund such as the Vanguard Windsor Investor fund (VWNDX). Its three-year return grade of A is based on how it performed relative to other funds in the U.S. equity large-cap value category. While it ranks in the top 20% in terms of performance within its category, its average annual return of 13.8% over the past three years lags the average annual return of around 19% for the market as a whole over that same period.
When looking at category risk, again, understand that the grades compare funds in the same category. Let’s say you were looking for a U.S. equity fund with “low risk” and came across the Touchstone Small Cap Value fund (TVOCX) with a category risk index score of 0.92 (meaning it is 8% less volatile than the typical fund in its category, U.S. equity small-cap value). If you didn’t dig any further, you may be left with the impression that the fund has low risk. In fact, it does—relative to other funds in its category. However, you may be less inclined to this fund if you saw its total risk index value of 1.65. This number means that the fund is 65% more volatile than the overall market. This underscores the need to understand the data points you are using to evaluate a mutual fund or ETF.
While the A+ fund and ETF grades offer a better apples-to-apples comparison for funds in the same category, it is important to keep the bigger picture in mind as well.


