While there are tens of thousands of mutual funds to choose from, either by choice or necessity we may be limited to investing in only one or a handful of fund families.
For example, through my AAII 403(b) retirement account I can only invest in Vanguard funds. So, to sift through a listing of Fidelity, Franklin Templeton or Invesco funds, etc., would be a waste of time.
As an A+ Investor subscriber, you have access to the Funds+ Screener, which allows you to run a variety of filters on a universe of over 24,000 mutual funds.
One filter you can run is based on fund family.
Looking at the Filter Menu on the left side of the Funds Screener page, you can scroll down the menu until you see the Purchase category. Click on the arrow to the left of Purchase to display the individual filtering items within the Purchase category:
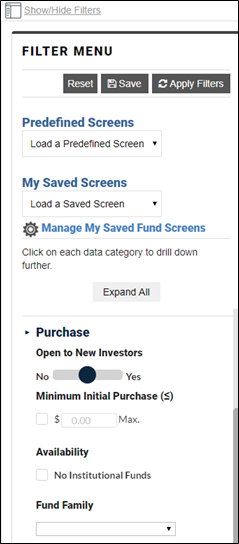
Clicking on the drop-down menu under Fund Family displays all of the fund families tracked by the A+ Investor mutual fund database, which comes from Morningstar.
To apply this or any filter(s) you select, click the blue Apply Filters button at the top of the Filter Menu:
While I have narrowed the universe of mutual funds down considerably (roughly 99%), 302 funds is still a significant number from which to choose.
When deciding what type of funds to look for, you have three levels to choose from. Global Asset Class, Fund Group and Category. For the sake of this screen, which will look for Vanguard funds invested in U.S. value stocks, I made the following selections:
At this point I am not worried about company size (large-, mid- or small-cap) or investment style (blend, growth or value).
I am also indifferent when it comes to whether the fund is socially responsible or an index fund, so I kept the respective slider bars in their middle or “neutral” positions.
As of July 31, there are 93 Vanguard funds focused on U.S. equities.
The NAV return of a fund is calculated based on the daily net asset value (NAV) of the fund reported after the stock market’s close each trading day. The NAV represents the total assets minus total liabilities divided by outstanding shares. The value changes daily, with the fluctuation of assets based on market value. Mutual fund NAVs are calculated daily after the market close. Exchange-traded funds (ETFs) report NAV, but they also trade intraday and their trading price may deviate from the NAV value. In this example, I am looking at a traditional open-end mutual fund.
It is important to point out that the percentile rankings for performance look at the funds within the same category (large blend, mid-cap growth, small value, etc.). This comparison is not against the stock market or the entire universe of funds.
Here I focused on trailing one-, three-, five- and 10-year performance, seeking performance in the upper 30% within the fund’s category for each period (70th to 100th percentile for 1-Year, 3-Year, 5-Year and 10-Year Category Rank).
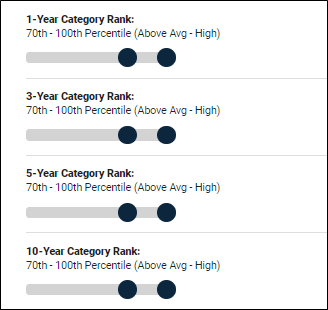
To arrive at the desired range for the various period ranks, I positioned the blue sliders as shown above.
These performance filters reduced the number of Vanguard funds from 93 to 15 with data as of July 31, 2021.
I am especially cost-conscious and recognize the impact fees can have on my long-term performance. Therefore, I seek out no-load funds, so I check the box next to “No-load funds only” under the Cost & Fees category and move the slider for Expense Ratio Category Rank to capture only the 0 to 20th percentile (expense ratio in the bottom 20% within the category).
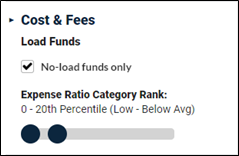
Given Vanguard’s historically low fee structure for mutual funds, I am not overly surprised that even these restrictive cost requirements left me with 15 Vanguard funds.
Under characteristics, you can choose from several data fields: Yield, Total Assets, Turnover, Leveraged and Inverse.
Since I am looking for value stocks, I do pay attention to yield. For this reason, I want to invest in mutual funds that are yielding more than their category average.
The total assets held by the fund don’t concern me.
However, I do want a fund that keeps turnover under control, so I select the box under Turnover to isolate those funds with turnover no more than (the less than or equal to sign) the category average.
I also don’t want the fund to deploy leverage to boost returns nor do I want funds designed to perform as the inverse of whatever benchmark or index the fund is designed to track. So, I slide the toggle over to No under both Leveraged and Inverse.
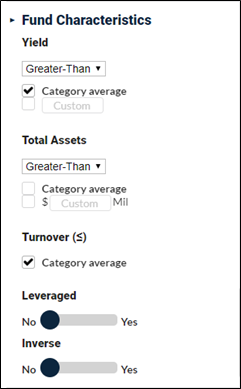
Here, these filters reduced the number of Vanguard funds to 12.
Under Purchase, you can specify Open to New Investors, Minimum Initial Purchase amount, Availability, Fund Family and Share Class Type.
My biggest concern here is that I can invest in any funds that pass my screen, so I moved the slider over to Yes under Open to New Investors.
Since I will be investing in these funds via my retirement account, I am not concerned with the minimum purchase amount and will not exclude institutional funds.
However, as I earlier selected, I am only interested in Vanguard funds.
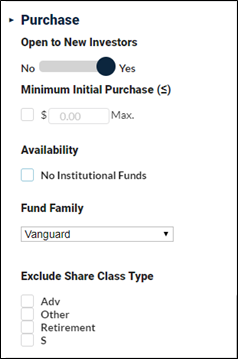
This round eliminated one fund, leaving me with 11 from which to choose.
Risk & Volatility looks at Category Risk and Total Risk.
Total risk is volatility relative to all funds—stock, bond, domestic, international, etc. It is helpful to understand how the risk of a bond fund compares to that of an equity fund, but since I am looking for funds within a specific fund category, the category risk is my primary focus.
At my age, risk doesn’t play a large role in my fund selection, so I did not adjust the sliders for category or total risk.
Manager tenure allows you to specify how long the lead manager has been with the fund. Tenure is more of an issue with actively managed funds than passive (index) funds, but as an example I required a manager tenure of at least one year.
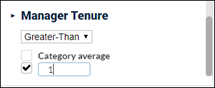
After specifying all of my filters, I clicked on the blue Apply Filters button at the top of the Filter Menu.
In all, 11 funds passed my screen. The image below shows the 10 Vanguard U.S. equity funds with the 10 highest five-year annualized returns:
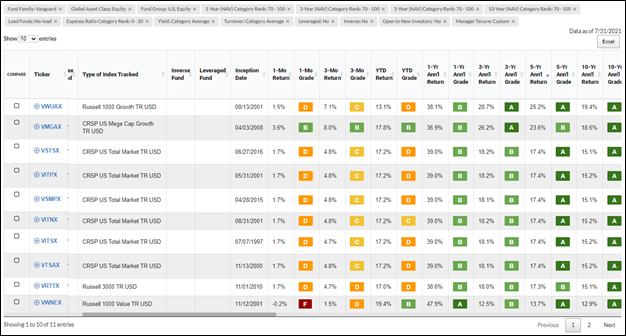
Given the outperformance of large stocks over the last several years, it is not surprising that this final group of mutual funds is clustered around large-cap stocks.
The choices you make from a screen such as this would most likely be determined by your desired asset allocation and style preferences.
You can save mutual fund (and ETF) screens that you have created by clicking the Save button at the top of the Filter Menu area. You can access screens you have saved from the drop-down menu under My Saved Screens. Once you have loaded a screen (from the predefined list or your saved screens), you can modify it and resave it. With predefined screens, you can save them under a different name (you cannot overwrite a predefined screen); with one of your own screens, you can either overwrite it or save it under another name.
All of the data columns in the table displaying the passing funds are sortable, in ascending and descending order, by clicking on the column header.
If you wish to do a side-by-side comparison of funds that passed a screen, click in the boxes in the Compare column at the far left for those funds. As you select funds to compare, their tickers will appear at the bottom of your browser window. When you are finished, click the green Compare button. This will open a new browser window with a variety of return, risk and expense data to let you compare the funds you selected.
Lastly, you will see yellow “+” signs next to tickers throughout A+ Investor. Clicking on that symbol allows you to add that ticker—stock, mutual fund or ETF—to an existing or new portfolio of yours in My Portfolio.
This is an updated version of an article that ran on March 23, 2020.

