One of the more popular features of A+ Investor is the Stock Grades. This system is a grading tool based on percentile rankings of multiple key metrics within five investment factors: value, growth, momentum, earnings estimate revisions and quality.
These grades represent a summary of a company’s fundamentals and give you a quick overview of how stocks rate based on five investment factors that, historically, have produced market-beating results.
Another popular benefit of AAII membership is the various stock screens that AAII tracks. As a subscriber to A+ Investor, you receive daily updates to these passing company lists.
To help you evaluate these screens based on the A+ Stock Grades, we also calculate average grades for each stock screen based on the latest set of passing companies.
To access the complete list of all the stock screens AAII has developed and tracked, select the “Explore All Screens” from the Screening drop-down menu on AAII.com:
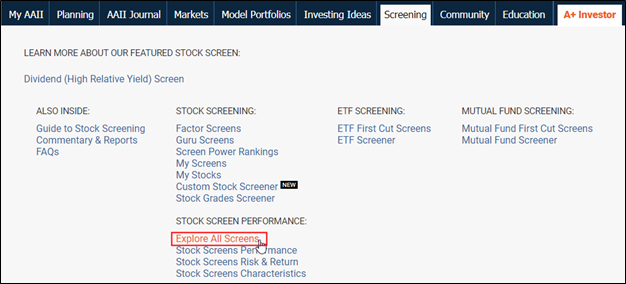
The link will take you to the All Screens view, with a table listing the 60+ stock screening strategies AAII tracks:
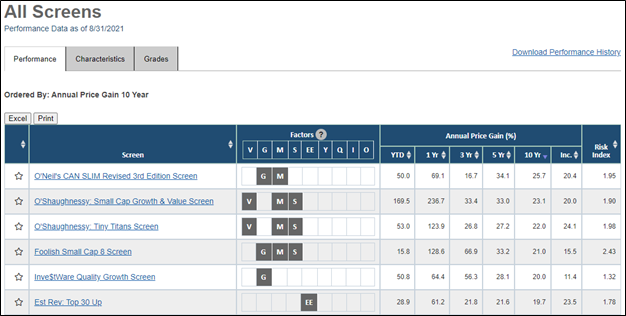
By default, the All Screens list displays the Performance tab with various periodic performance stats for all the stock screens AAII tracks. You can sort the table by any of the performance columns.
In addition, the Factors column indicates the underlying characteristics of the various screens. For example, the O’Shaughnessy Small Cap Growth & Value screen, which is up 169.5% for 2021 through the end of August, uses filters identified with value (V), momentum (M) and size (S).
The screen looks for small-cap companies with a market capitalization between $200 million and $2 billion. Furthermore, companies passing the O’Shaughnessy Small Cap Growth & Value screen must have a price-to-sales ratio of less than 1.5 and have seen earnings per share increase over the trailing 12 months. In addition, the screen requires companies to have above-average 13- and 26-week price strength relative to the S&P 500 index.
Only the 25 companies with the highest 52-week relative price strength are displayed in the passing companies list for this screen.
On the “All Screens” page is a subtab for Grades:
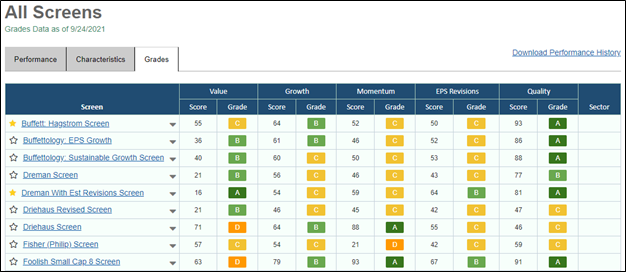
This table shows the average grades for each AAII stock screen based on the companies that currently meet the screen’s criteria. The passing companies and average screen grades are updated daily through the close of the previous trading day (for A+ Investor and Stock Investor Pro subscribers).
Clicking on the down arrow to the right of each screen name will show you the companies currently passing the screen, their individual A+ Stock Grades and their sector, as defined by The Refinitiv Business Classification (TRBC). For example, as of the close on September 24, 2021, 20 stocks passed the David Dreman With Estimate Revisions screen:
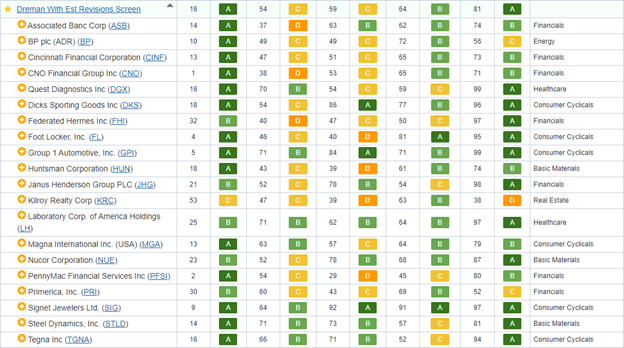
Based on the A+ Stock Grades for these 20 companies, the grades for the Dreman With Estimate Revisions screen are:
By providing the average A+ Stock Grades for all AAII Stock Ideas screens, you get a clearer picture of the types of stocks that pass each screen. This, in turn, will help you decide whether a given strategy fits your own investment philosophy.
If you gravitate more toward value stocks, you may not be interested in stock screens where the average A+ Value Grades are consistently D’s or F’s. Likewise, growth investors may want to look past those screens with low average A+ Growth Grades.

