With the market seeing weakness not experienced for several months, I thought it would be a good idea to dust off this Making the Grade article that discusses price momentum.
Research confirms that momentum is as significant a characteristic to seek in stocks as value, size or volatility. Momentum is not only for short-term traders and those who rely on technical analysis. It has also been found to aid those who focus on fundamental analysis.
Price momentum is usually measured by comparing the price change of a stock over a specified period relative to a benchmark, such as the S&P 500 index, or against a segment of stocks; the resulting number is called relative strength. If Trade Desk Inc.  (TTD) shares gain 30% and shares of Zscaler Inc. (ZS) rise by 10% over the same period, Trade Desk will have better relative strength. Its stock performed better than Zscaler’s shares in the same amount of time.
Relative strength has grown in popularity as a characteristic used in selecting stocks. Several research studies and successful investors have highlighted the benefit of seeking out stocks with high relative strength, especially when combined with other fundamental selection characteristics, such as size and value.
Price momentum is often used as a signal that the market has recognized that the stock price is reacting to the investing concept. Investors look for stock price performance better than other stocks in the belief that the rising price will attract other investors, which will drive up the price even more. Relative strength’s utility is built on the assumption that it persists over time. Momentum is considered an anomaly because if the market was pricing in all known information, then a stock’s future returns shouldn’t be influenced by past returns.
In “What Works on Wall Street” (McGraw-Hill, 2011), James O’Shaughnessy’s findings show a performance advantage to using both six- and 12-month relative strength. In both cases, stocks with relative strength in the top 30% or higher had annualized returns of approximately 12% or higher versus 10.5% or higher for his all-stock universe. O’Shaughnessy’s data is from 1927 through 2009. Other studies show a performance advantage to using 13-week relative strength as well as the aforementioned time periods.
There are several ways to measure price performance, typically on either an absolute or a relative basis. Price change over a specified period is an example of absolute performance. Relative performance communicates how well a stock has performed compared to some benchmark, usually a market or industry index. The most basic means of calculating relative strength is by dividing the percentage price change of a stock over some time frame by the percentage change of a market index over the same period.
The concept of momentum is accepted in academic and practitioner circles, with some researchers theorizing that momentum reflects herding behavior. For example, investors with limited information will favor what’s popular and what has outperformed recently. This fits the theory that investors prefer winners over losers and behavioral tendencies such as recency bias, which is the tendency to think current trends will continue.
Though momentum has been shown to lead to good returns, it’s not appropriate for every strategy. Its downsides can give investors reason for pause. Momentum does not have staying power on an aggregate basis. While some stocks can retain high relative strength levels for an extended period, relative outperformance is fleeting for others. Research found momentum’s advantage to wane after one year for the average stock. Due to the lack of staying power, portfolio turnover can be higher than other factors.
A far bigger concern with momentum is the potential for the factor to backfire or “crash.” This occurs when stocks with the worst past relative performance (e.g., over the past 12 months) outperform those with the best relative performance. As a result, returns are adversely affected by buying winners and selling or avoiding losers. A shift in sentiment causes momentum crashes. The past losers rise at a faster pace than the past winners do. This results in underperformance for past winners and negative returns for a portfolio with a long position in past winners and a short position in past losers.
Subscribers to A+ Investor can view Stock Grades based on the momentum factor for a given company. The Momentum Grade uses the weighted four-quarter relative strength price change for each of the past four quarters to rank companies. The most recent quarterly price change is given a weight of 40% and each of the three previous quarters are given a weighting of 20% (below).
Using the A+ Stock Grades Screener, I ran a series of filters that looked for companies with momentum and quality grades of A, grades of B or better for growth and revisions and valid (non-null) value grades. As of the close on Friday, October 1, 26 companies meet these requirements. A partial list of the 10 passing companies with the highest momentum score is shown here:
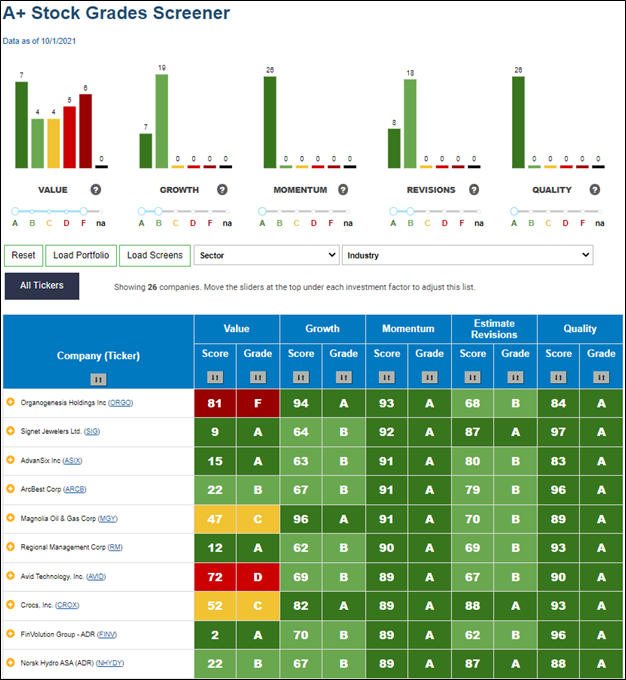
Organogenesis Holdings Inc. (ORGO) has the highest momentum score of 93.
Organogenesis Holdings is a regenerative medicine company that focuses on developing, manufacturing and commercializing product solutions for the advanced wound care, surgical and sports medicine markets. It also provides integrated healing solutions that substantially improve medical outcomes. The company’s advanced wound care and surgical & sports medicine products include PuraPly, Antimicrobial (PuraPlyAM), Affinity, NuShield, Apligraf and Dermagraft. Organogenesis Holdings offers a portfolio of bioactive and acellular biomaterials products in advanced wound care and surgical biologics, including orthopedics and spine.
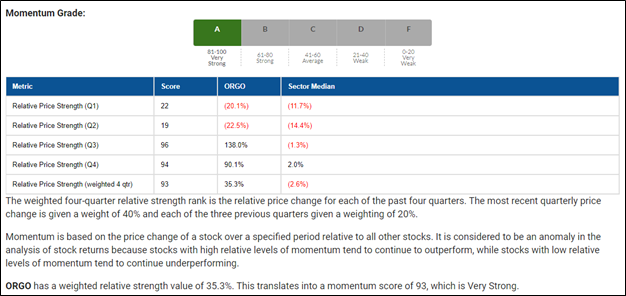
As shown above, Organogenesis Holdings’ weighted four-quarter relative strength price score was 93 as of the close on October 1, 2021. Over the past year, the company’s weighted four-quarter relative strength is 35.3%, meaning its weighted price change over the last 52 weeks outperformed the S&P 500 by more than 35 percentage points.
By comparison, the typical stock in the health care sector has underperformed the S&P 500 on a weighted basis by nearly three percentage points over the past year.
Looking at Organogenesis Holdings’ quarterly relative strength figures, the company has ranked no lower than the 94th percentile over the first half of the past four calendar quarters (Q4 and Q3). Four quarters ago, the company outperformed the S&P 500 by 90 percentage points and outpaced the S&P 500 by 138 percentage points three quarters ago (shown in column labeled ORGO in image above).
More recently, the story has changed. Organogenesis Holdings’ shares underperformed the S&P 500 by 20 percentage points in the current quarter and lagged the market by nearly 23 percentage points last quarter.
Being able to see the quarterly price strength helps you determine whether price momentum is building or fading over time.
Note that company performance equal to that of the S&P 500 is represented by a relative strength index of 0.0%; companies outperforming the S&P 500 have positive relative strength figures while those underperforming the S&P 500 have negative relative strength values.
When interpreting relative strength, it is important to note that even a stock that is rapidly rising in price may have weak relative strength if the market is rising faster than the stock. Likewise, a stock falling in price will show positive relative strength if it is declining more slowly than the overall market.
The concept of momentum using relative strength can be a revealing and useful investment analysis tool to consider as you look for stock ideas and manage your holdings. Momentum has been associated with higher returns over the long term.

