 CVS
CVS
The A+ Stock Grades system is a grading tool based on percentile rankings of multiple key metrics within five investment factors: value, growth, momentum, EPS estimate revisions and quality. They represent a summary of a company’s fundamentals and give you a quick overview of how a stock rates based on the five investment factors that have been shown to produce market-beating results.
You get a letter grade for each of the five investment factors, and you can also see the percentile rankings of the underlying data points for each grade. In addition, we provide a list of the company’s competitors and their letter grades. These grades are calculated and updated daily.
This week we revisit the A+ Value Grade, including the underlying data points we use to calculate it and the methodology for awarding the grades.
For the A+ Value Grade, we use the price-to-book-value (P/B) ratio, price-to-sales (P/S) ratio, price-to-free-cash-flow (P/FCF) ratio, price-earnings (P/E) ratio, the ratio of enterprise value to earnings before interest, taxes, depreciation and amortization (EV/EBITDA) and shareholder yield.
To ensure the validity of the factors used for the Value Grade, we backtested the scoring system results across all letter grades (A to F) from 1998 through 2019.
Here are the results:
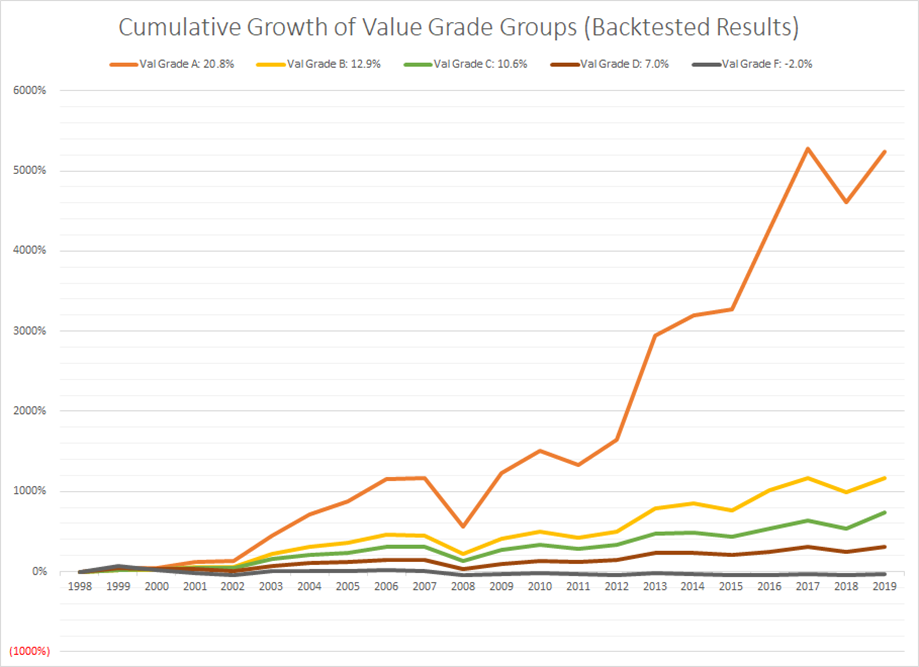
As we would expect, moving from Value Grades of F to D to C to B to A resulted in better cumulative returns for each higher grade. Even between Value Grades of A and B, the higher letter grade outperformed the lower by more than a factor of four on a cumulative basis over the backtesting period.
Here are CVS Health Corp.’s (CVS) valuation measurements from its Stock Evaluator page used for its Value Grade with data as of the close on Wednesday, September 14, 2022:
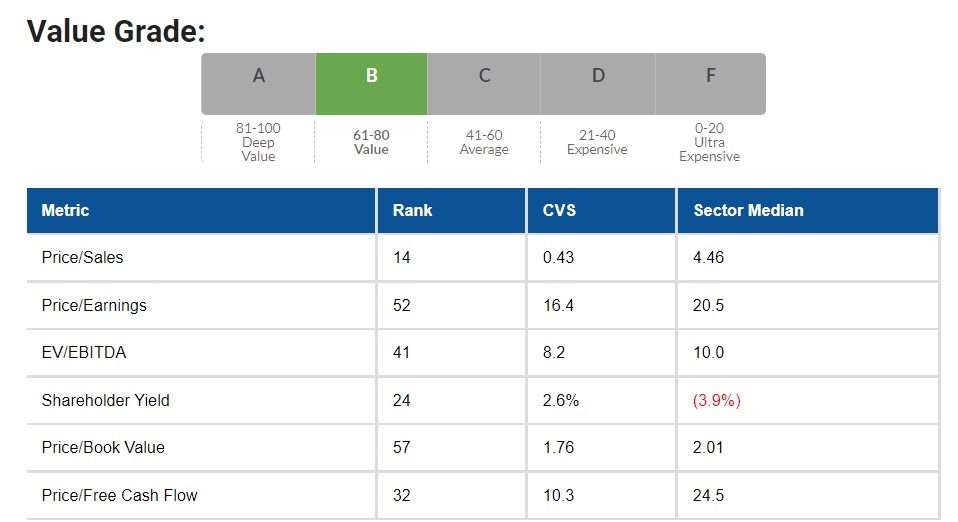
The Rank column for each of the six valuations used for the Value Grade is the percentile rank for the company. So, for example, CVS ranked in the 14th percentile for the price-to-sales ratio as of the close on September 14. The CVS column is the actual value for the company for each of the six factors. In this example, CVS traded at 16.4 times trailing earnings per share as of the close on September 14 (price-earnings ratio).
The Sector Median column displays the median values for the company’s respective sector. For example, in the case of CVS, the median price-to-book ratio for the companies in its sector, designated as health care by The Refinitiv Business Classification (TRBC), was 2.01 as of the close on September 14, compared to 1.76 for CVS.
The final letter grade is based on the percentile rank of the average of the six different valuation metric scores. A percentile rank of the averages provides a more uniform distribution across all letter grades. The rank is scaled to assign higher scores to stocks with the most attractive valuations and lower scores to stocks with the least attractive valuations.
For CVS, the average score for its six valuation metrics was 73 as of September 14. This translates to a Value Grade of B, which is considered to be Value.
Price to Sales
Seeking undervalued stocks based upon the price-to-sales (P/S) ratio was first popularized by Kenneth Fisher in his 1984 book “Super Stocks.” Proponents of the price-to-sales ratio argue that earnings-based approaches to selecting stocks are inferior because earnings are influenced by many management assumptions trickling through the accounting books. Basing value relative to sales tends to be more consistent than basing value relative to earnings. Temporary developments such as costs incurred in a new product rollout or a cyclical slowdown can influence earnings more than sales, often leading to negative earnings. The price-to-sales ratio can provide a meaningful valuation tool when negative earnings render earnings-based models useless. Recent research indicates that using price-to-sales ratios may lead to better investment results than price-to-book-value ratios or price-earnings ratios.
The price-to-sales ratio is determined by dividing the market price per share by the sales per share for the most recent 12 months.
Price to Earnings
The price-earnings ratio, or earnings multiple, is one of the most popular measures of company value. It is computed by dividing the current stock price by earnings per share for the most recent four quarters. Analysts and investors follow it closely because it relates the market’s expectation of future company performance—embedded in the price component of the equation—to the company’s actual recent earnings performance. The greater the expectations, the higher the multiple of current earnings investors are willing to pay for the promise of future profits. If the market has low earnings growth expectations or views earnings as suspect, it will not be willing to pay as much per share as it would for a firm with high and more certain earnings growth expectations.
The price-earnings ratio is determined by dividing the market price per share by earnings per share for the most recent 12 months.
Enterprise Value to EBITDA
The enterprise-value-to-EBITDA (EV/EBITDA) ratio helps measure the value of a stock relative to its earnings potential. Many investors feel that a company’s enterprise value relative to its EBITDA is better to measure company value than the price-earnings ratio alone. The ratio is neutral to the company’s capital structure and capital expenditures.
A company’s enterprise value represents its economic value, which is the minimum value that would be paid to purchase the company outright. Enterprise value equals the market value of equity (including preferred stock), plus interest-bearing debt, minus excess cash. Enterprise value considers both the market price of equity and the debt used to generate earnings. Companies with debt must pay interest on the debt and eventually pay off the debt. This makes the company’s true acquisition cost higher. Adding debt to market capitalization lowers the enterprise-value-to-EBITDA ratio, making a company less attractive. Excess cash is subtracted from enterprise value because the unneeded cash reduces the overall cost of acquiring a business. EBITDA ends up serving as an approximation of the firm’s operating cash flow.
The enterprise-value-to-EBITDA ratio is determined by dividing enterprise value for the most recent quarter by EBITDA for the most recent 12 months.
Shareholder Yield
A stock’s shareholder yield is the sum of its buyback yield and dividend yield. It shows what percentage of total cash the company is paying out to shareholders, either in a cash dividend or as expended cash to repurchase its shares in the open market. Thus, if a company pays a 5% dividend yield and has a buyback yield of 10%, its shareholder yield would be 15%.
A stock’s buyback yield is determined by comparing the average number of shares outstanding for one fiscal period with the average number of shares outstanding for another fiscal period. In this case, the average shares outstanding for the latest fiscal quarter is compared to the average shares outstanding in the same fiscal quarter a year ago. For example, if a stock currently has 90 million average shares outstanding and had 100 million average shares outstanding one year ago, the buyback yield would be 10%. Note that the buyback ratio can be negative if outstanding shares have increased.
Unlike other valuation measures, shareholder yield is inversely related to “value,” with higher shareholder yields implying lower valuations.
Shareholder yield is determined by adding the current buyback yield to the current dividend yield.
Price to Book Value
The price-to-book-value ratio was a favorite measure of Benjamin Graham and his disciples, who sought companies with a share price below their book value per share. While the market does a good job of valuing securities in the long run, in the short term, it can overreact to information and push prices away from their true value. Measures such as the price-to-book ratio help identify which stocks may be undervalued and neglected.
Eugene Fama and Kenneth French’s “The Cross-Section of Expected Stock Returns,” published in the June 1992 Journal of Finance, is among the most cited research on the performance of the price-to-book ratio in modern times. In the study, they documented significantly higher returns for portfolios of low price-to-book stocks compared to portfolios of high price-to-book stocks. Data published on French’s website show portfolios constructed of stocks whose price-to-book ratios rank in the bottom third of all stocks beating portfolios of stocks whose high price-to-book ratios rank in the top third by an annualized difference of 9.9% per year between 1927 and 2017.
Book value is generally determined by subtracting total liabilities from total assets and dividing by the number of outstanding shares. It represents the value of the shareholder’s equity based upon historical accounting decisions.
The price-to-book ratio is calculated by dividing the share price by book value per share.
Price to Free Cash Flow
A company’s sales and earnings are useful measures, but for a company to survive, it must have the cash to finance its activities. Companies that generate sufficient cash can expand during periods of economic expansion and cover expenses when sales decline during slowdowns.
Cash flow is reported on the cash flow statement. The cash flow statement is harder to manipulate through accounting techniques than earnings. Cash flow is the sum of cash from operations, cash from investing and cash from financing adjusted for exchange rate effects. Unlike earnings, which are an accounting figure, cash flow represents the net total of cash flowing into and out of the company over a given period. Free cash flow is calculated by subtracting capital expenditures and dividend payments from cash flow from operations.
The price-to-free-cash-flow ratio is calculated by dividing the share price by free cash flow per share for the most recent 12 months.

