 BBW
BBW
Happy New Year to everyone! After the year 2021 turned out to be a pleasant surprise from a stock market perspective, I want to take this opportunity to look back on the performance of AAII’s Stock Screens.
As an AAII member and A+ Investor subscriber, you have access to over 60 stock screens with daily updates of the companies passing each of these screens.
To access the complete list of all the stock screens AAII developed and tracks, select “Explore All Screens” from the Screening drop-down menu on AAII.com:

The link will take you the All Screens view, with a table listing the 60+ stock screening strategies AAII tracks:
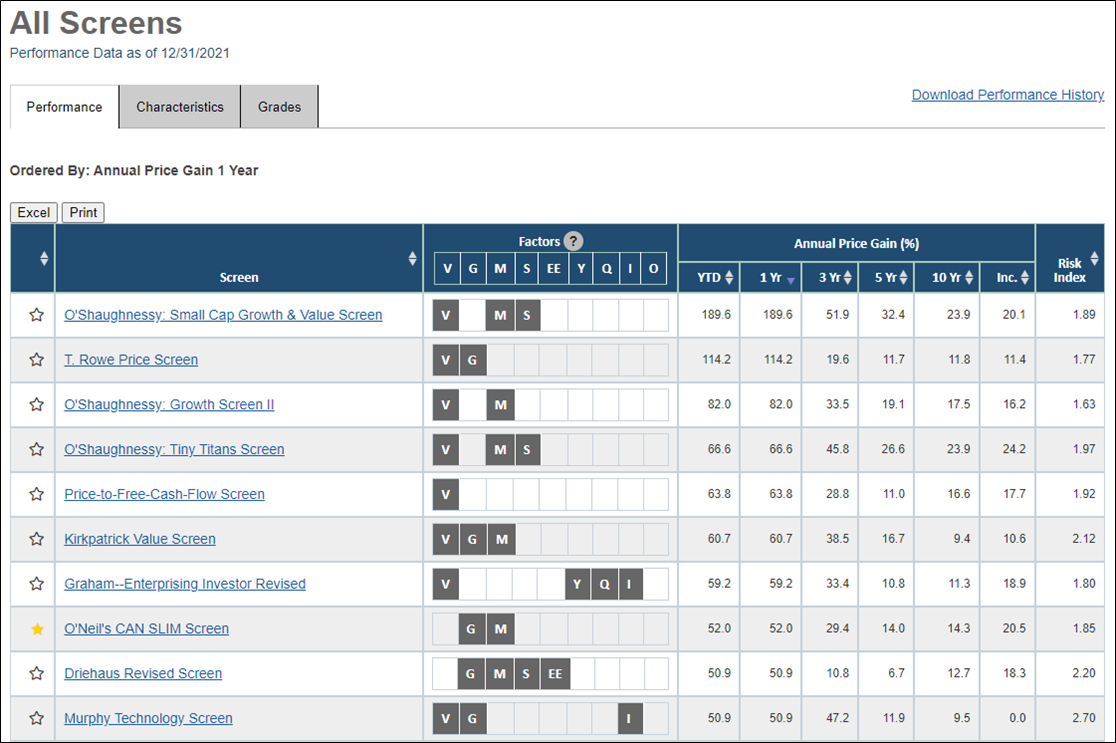
For 2021, the top-performing AAII stock screen was the O’Shaughnessy Small Cap Growth & Value strategy, which posted a theoretical return of 189.6%. This performance figure is derived by calculating the average monthly return for the stocks passing this and every other stock screen each month. It is worth pointing out that the performance figures are not based on real-money investments, and they do not include some elements such as transactions costs (commissions, bid-ask spreads, etc.) or dividend reinvestments.
From this table, you can also sort all the stock screens based on long-term performance. Doing so, we see that the Foolish Small Cap 8 screen is the top-performing AAII strategy over the last three years. This screen was the top-performing screen of 2020, with a theoretical return of 142.5% for the year. (Year-by-year returns are shown on the Stock Screens Risk & Return table.) Highlighting the fact that strategies rotate in and out of favor, the Foolish Small Cap 8 screen was one of only 10 AAII Stock Screens that posted a loss in 2021, losing 3.2%.
The O’Shaughnessy Small Cap Growth & Value approach does have the best average return over the past five years at 32.4%. It ranks second in three- and 10-year performance and fifth in performance since inception (the beginning of 1998).
In addition, the Factors column of the table indicates the underlying characteristics of the various screens. For example, the O’Shaughnessy Small Cap Growth & Value strategy uses filters identified with value (V), momentum (M) and size (S) investing.
To learn more about any of the AAII stock screens, you can click the link for a strategy from the table above:
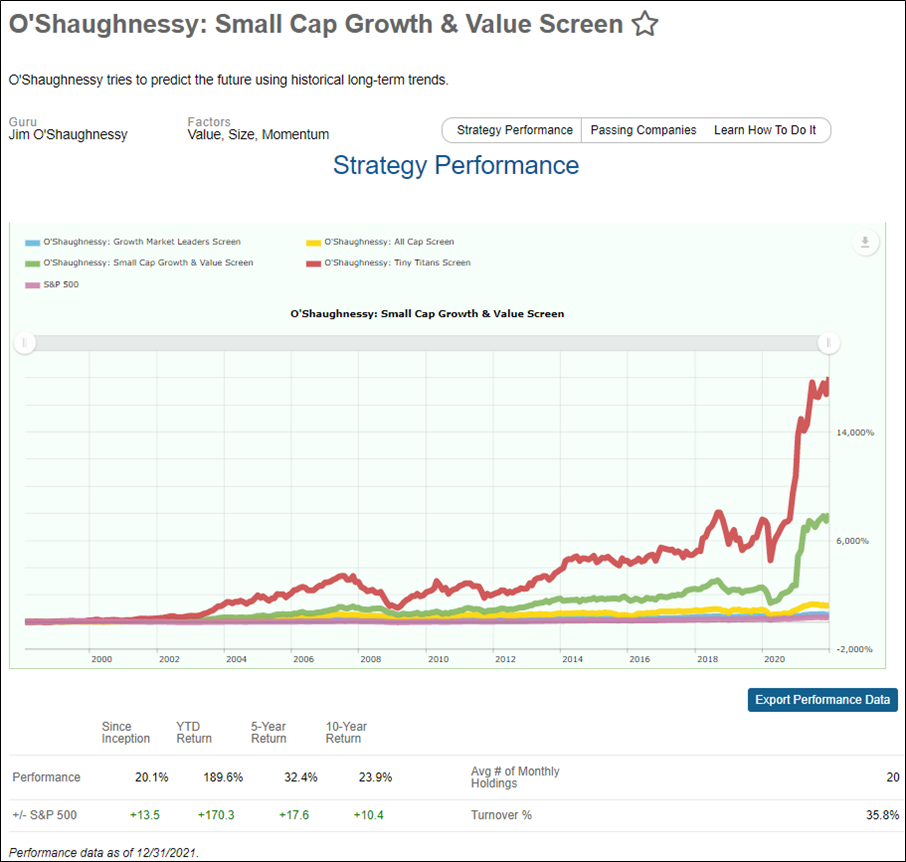
Here we see a graphical representation of the O’Shaughnessy Small Cap Growth & Value screen’s performance since the beginning of 1998, as well as the average number of companies passing the screen each month (20) and the average monthly turnover (35.8%).
Scrolling down, we see the list of companies currently passing the screen, as of the close of the previous trading day, which in this case was January 7, 2022:
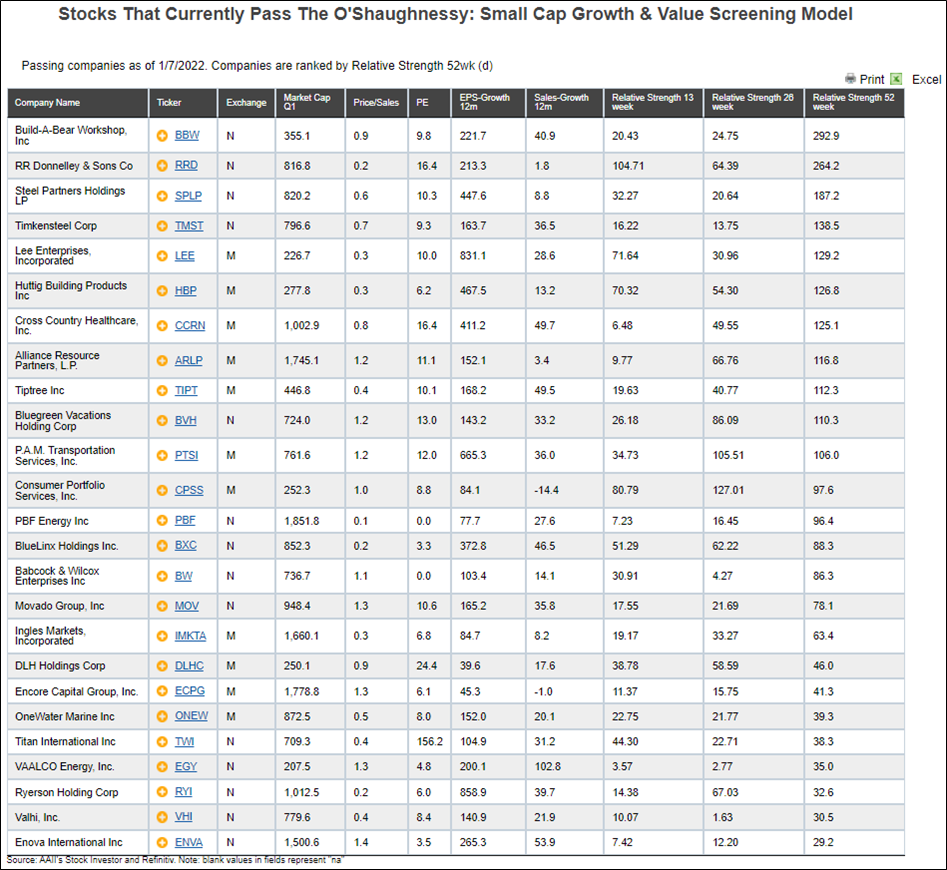
We will return to this list shortly.
We also provide an in-depth article describing the strategy and the rationale for the criteria each of the AAII Stock Screens use. And, since these are not “black box” screening systems, we also provide the exact screening criteria used to arrive at the passing company listings.
The screen looks for smaller companies with market capitalizations between $200 million and $2 billion. For a time, James O’Shaughnessy viewed the price-to-sales ratio as the more predictive valuation metric. He has since admitted this “mistake” and now favors a composite approach, which serves as the basis for the A+ Investor Value Grade. However, this screen version of the O’Shaughnessy approach looks for “cheap stocks” based on the price-to-sales ratio. Specifically, those companies with a ratio of less than 1.5.
The O’Shaughnessy Small Cap Growth & Value screen also requires companies to have positive earnings per share growth over the trailing 12 months.
O’Shaughnessy research over the years, as well as that of others, shows that momentum is a successful long-term investment strategy, especially when coupled with value-oriented strategies.
Multiple price appreciation factors also help find companies that are growing earnings and whose stock prices are rising. This screen looks for stocks with above-average 13- and 26-week relative strength.
Finally, the list of passing companies is narrowed to the 25 stocks with the highest 52-week relative strength.
To learn more about the companies passing any of the AAII stock screens, you can click on any ticker from the passing company list.
For the O’Shaughnessy Small Cap Growth & Value screen, Build-A-Bear Workshop Inc. (BBW) ranked highest among all the passing companies as of January 7, 2022, in terms of 52-week relative strength. Clicking on its ticker takes you to its Stock Evaluator page, which includes data and analysis that is exclusive to A+ Investor subscribers:
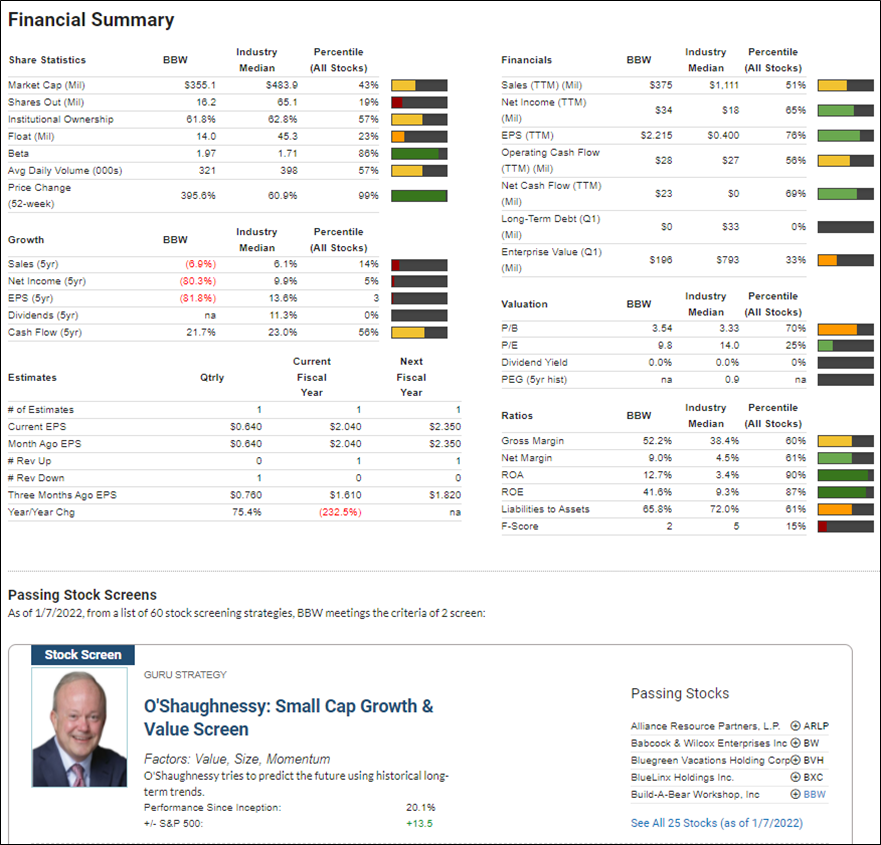
The Stock Evaluator page is designed to provide the data and information an investor needs to make an educated, unbiased decision as to whether to buy, hold or sell an individual stock.
The first page of the Stock Evaluator is the Snapshot tab, which is shown above. Here you will find select company and industry data to give you an overview of the company’s growth, financial strength, price performance and valuation.
A+ Investor subscribers will be able to take a deeper dive on the remaining tabs, including the Grades, Charts, News & Events, Valuation, Growth, Ratios, Analysts (analyst ratings), Earnings (consensus estimate data), Financials (detailed quarterly and annual financial statement data), Insiders (insider buy and sell activity) and Filings (reports filed with the SEC) tabs.
One of the most popular sections of the Stock Evaluator is the Grades tab. The A+ Stock Grades system is a stock-grading tool based on percentile rankings of multiple key metrics within five quant factors: value, growth, momentum, earnings estimate revisions and quality. They represent a summary of a company’s fundamentals and give you a quick overview of how a stock rates based on five investment factors that have been shown to produce market-beating results.
Not only do you get a letter grade for each of the five investment factors, but you can also see the percentile rankings of the underlying data points for each grade. In addition, we show the firm’s main competitors and their letter grades. These grades are calculated and updated daily.
Here we see the A+ Stock Grades for Build-A-Bear Workshop as of January 7, 2022:
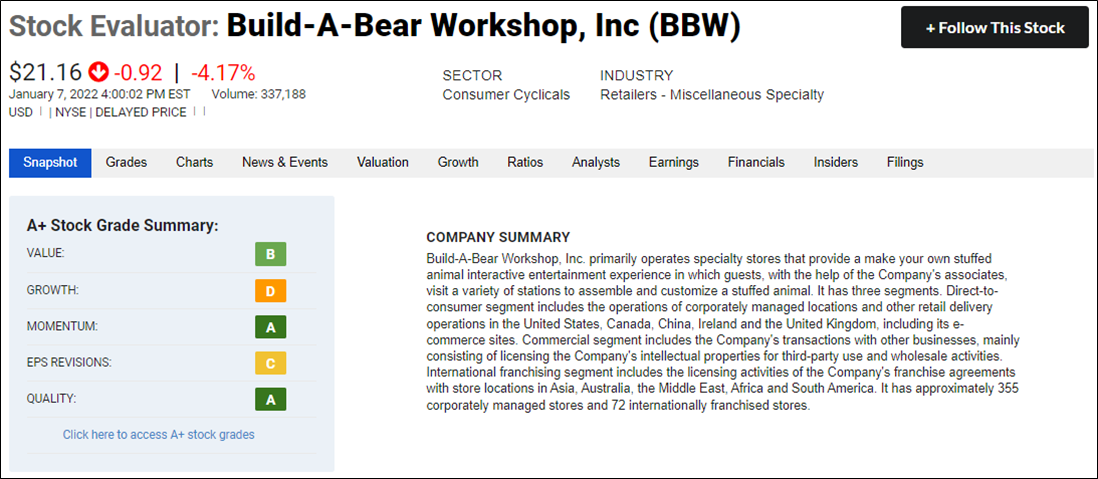
Given the underlying criteria used for the O’Shaughnessy Small Cap Growth & Value screen, it is not surprising to see Build-A-Bear Workshop with a Value Grade of B and a Momentum Grade of A.
The Grades tab of the Stock Evaluator provides a deeper dive into the underlying variables used for the various Stock Grades.
At the Screening area of AAII.com you will also find aggregate stock grades for all the AAII stock screens.
On the All Screens table presented earlier, there is a Grades tab:
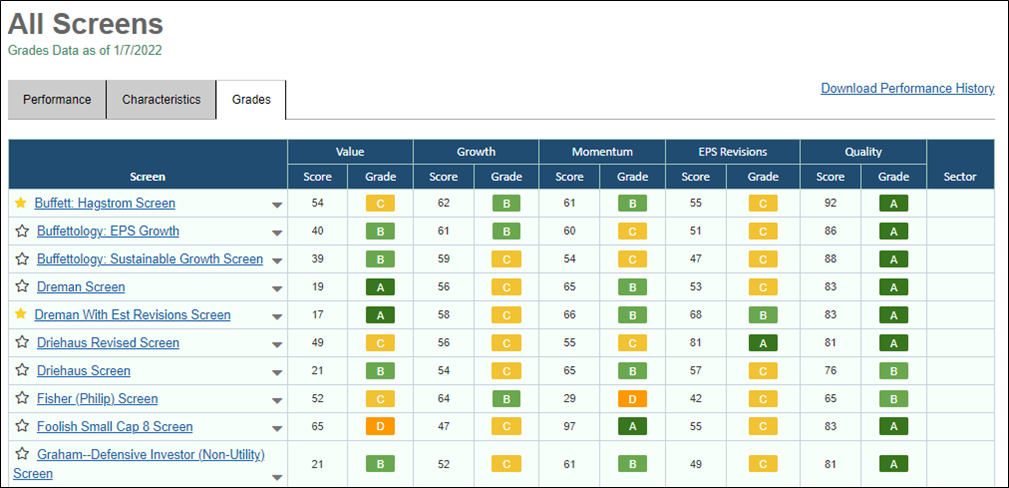
This table shows the average grades for each AAII stock screen based on the companies that currently meet the screen’s criteria. The passing companies and average screen grades are updated daily through the previous trading day’s close for A+ Investor subscribers.
Clicking on the down arrow to the right of each screen name will show you the companies currently passing the screen, their individual A+ Stock Grades and their sector, as defined by The Refinitiv Business Classification (TRBC).
By providing the average A+ Stock Grades for all of the stock screens, you get a clear picture of the types of stocks that pass each screen. This, in turn, will help you decide whether a given strategy fits your own investment philosophy. If you gravitate more toward value stocks, you may not be interested in stock screens where the average A+ Value Grades are consistently D’s or F’s. Likewise, growth investors may want to look past those screens with low average A+ Growth Grades.

