 ATKR
ATKR
Investing in the stock market has hit a speed bump over the past few weeks. The Nasdaq composite is officially in a “correction” having dropped more than 10% from its last all-time high set on November 22, 2021.
Part of the market’s decline is macro in nature—news that the Federal Reserve may be more aggressive in its fight against inflation and the economic impact of the surge of the omicron coronavirus variant.
Another part of the story is the rotation away from “growth” stocks to “value” stocks. Rising bond yields in anticipation of rising interest rates do not favor growth stocks. These stocks tend to trade at higher valuations based on expectations for high future earnings. However, rising interest rates are a headwind to earnings, except for financial companies. As expectations for future earnings weaken based on expectations for rising interest rates, these high valuations will adjust via falling stock prices.
While value stocks are gaining favor among investors, the general decline in the market is weighing on stock prices.
For value investors, the sweet spot in investing is being able to buy an undervalued stock right before its value is recognized by the market and just before its stock price begins to take off.
But how can a value investor tell when a stock is in the sweet spot? The answer, according to president of investment research company Valuentum Securities Brian Nelson, is to identify stocks with good value that are just starting to exhibit good technical/momentum characteristics.
Doing so helps an investor to avoid:
Several research studies—most notably a study done by Cliff Asness of AQR Capital, Tobias Moskowitz of the University of Chicago and Lasse H. Pedersen at the New York University in their paper “Value and Momentum Everywhere”—make the argument that value and momentum strategies work well together. In their research, Asness et al. show that, over time, combining value and momentum strategies across diverse markets and asset classes results in significantly higher risk-adjusted rates of return.
A+ Investors have access to the A+ Stock Grades Screener. The A+ Stock Grades allow users to evaluate roughly 7,000 stocks using factors that have been shown to identify stocks that outperform the market in the long term. These factors cover value, momentum, quality, growth and earnings estimate revisions (and surprises).
To identify companies whose stocks are exhibiting deep value and strong price momentum, I used the A+ Stock Grades Screener to first isolate stocks with Value and Momentum Grades of A. As of January 21, 2022, there are 7,017 companies in the A+ Investor stock universe. Of those, 242 have Value and Momentum Grades of A (1,061 stocks with only a Value Grade of A and 1,109 stocks with only a Momentum Grade of A). Our backtesting of the A+ Value Grade shows that companies with higher value grades perform better than those with lower value grades. This filter also helps to avoid low-value stocks that may have underlying issues that may warrant their low price multiples.
While these filters have done an excellent job of narrowing down the universe, this is still too large of a group of stocks to analyze. So, I added a third filter that looks for companies with a Quality Grade of A as well.
Adding the Quality Grade of A requirement lowers the number of passing companies from 242 to 83.
This is still too many stocks for my liking, so I added two additional filters requiring that a company’s Growth and Earnings Estimate Revisions Grades be B or better. This left me with 17 passing companies.
A subset of this group as of January 21, ranked in descending order by momentum score, is shown below.
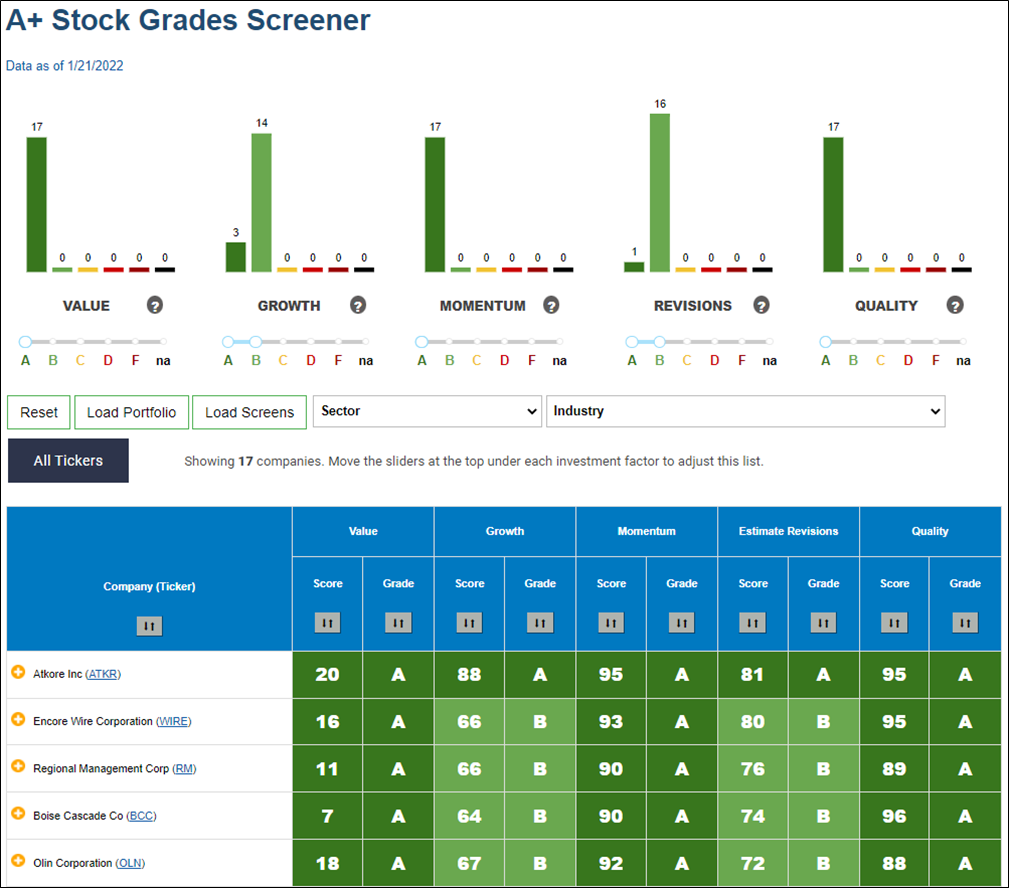
Atkore Inc. (ATKR) has the highest Momentum Score among the 17 passing companies, ranking in the top 5% of all U.S.-listed companies. The company is a manufacturer of electrical raceway products.
Atkore also has the highest Value Score among this set of companies, although this ranks in the bottom fifth of the entire stock universe. The company’s price-earnings ratio of 8.0 ranks in the bottom 19% of the stock universe and is well below the 22.9 price-earnings ratio (P/E) for the typical stock in the electrical components and equipment industry. The price-to-sales ratio of 1.53 ranks in the bottom 35% of all stocks and is below the industry median of 1.59. Atkore’s price-to-free-cash-flow ratio of 9.0 is attractive relative to the industry median of 22.6 and is in the bottom 25% of all U.S.-listed stocks.
Atkore’s shares have risen more than 101% over the last 52 weeks, outperforming the S&P 500 index by over 72 percentage points. Over the previous four weeks, Atkore’s shares underperformed the S&P 500 by almost four percentage points as they fell 8%.
I have been writing stock screening articles for over 20 years, and each time I add this important disclaimer for those looking at the results of a quantitative screen: The results are the starting point of your analysis, not the finish line.
Screening is beneficial for isolating companies that share common characteristics. But it is still up to you to do additional due diligence before deciding whether any of the companies are suitable for your portfolio.
It is also important to understand the screening filters you are using.
Relative strength is just that—a measure of price performance relative to a benchmark, in this case the S&P 500. In a declining market, a stock with high relative strength may still be falling in price, just at a slower rate than the benchmark.
The research studies by Asness and others provide evidence that combining value and momentum strategies offers investors the opportunity to achieve higher rates of return with lower risk than would be achieved with either strategy individually.
Screening tools such as the A+ Stock Grades Screener help you to quickly identify stocks at the intersection of deep value and robust momentum.

