The fourth-quarter has reached its apex. Calendar-year earnings season has peaked and is coming to an end. Through the close on November 12, 2021, 454 (90.8%) of the S&P 500 index companies have reported their latest results since the beginning of January.
Among the 7,076 publicly traded companies in the A+ Investor database, 4,366 have at least one analyst providing an estimate for their current fiscal quarter. Of those, 2,490 have reported quarterly results since the beginning of the year, with 1,139 (45.7% of companies having reported) reporting earnings that exceeded the mean estimate by at least one standard deviation (a SUE score of at least 1.0).
By comparison, 450 (18.1%) of the companies in the A+ Investor database with analyst coverage have reported earnings for the current earnings season that fell short of the consensus estimate by more than one standard deviations (SUE score of –1.0 or lower).
Out of the 2,490 companies that have reported since the beginning of January, 640 (25.7%) have seen analysts boost their mean estimates by at least 5% over the past month for the current fiscal quarter or current fiscal year.
As of February 25, FactSet reports that 76% of S&P 500 companies have reported a positive earnings surprise, which is in line with the five-year average. However, the amount by which companies are beating estimates is below the five-year average. FactSet also reports that the S&P 500 is reporting earnings growth of more than 30% for the fourth straight quarter and earnings growth of more than 45% for the full year. The numbers are tempered by easier comparisons to weaker earnings in 2020 due to the negative impact of the coronavirus pandemic on corporate earnings.
Stock prices of firms that significantly exceed analyst expectations (positive earnings surprise) tend to outperform the market, while those with negative surprises tend to underperform.
The impact of the earnings surprise is longer lasting than most would think. The most significant effect of the surprise can be seen immediately, but the impact of the surprise may be felt for as long as a year. The effect tends to last longer for negative earnings surprises. It simply takes time for the market to recognize that a fundamental shift is taking place. This means that it does not generally make sense to be a bargain hunter and buy a stock after the initial price decline on a negative earnings surprise. There is a good chance the stock will continue to underperform the market for some time. Separately, it may not be too late to buy into an attractive stock after a better-than-expected earnings report is released, provided the fundamentals are still valid.
Not surprisingly, large firms tend to adjust to surprises faster than small firms. Larger firms are followed by more investors, analysts and portfolio managers who act on the information quicker and more thoroughly.
Changes in estimates reflect analyst expectations of future performance changes and lead to price adjustments similar to earnings surprises. When earnings estimates are revised significantly upward—5% or more—stocks tend to show above-average performance. Conversely, stock prices of firms with downward revisions show below-market performance.
Changes in analyst estimates are more meaningful when individual estimates move away from the average rather than toward the consensus.
A+ Investor subscribers have exclusive access to A+ Stock Grades for more than 7,000 stocks for factors of value, growth, momentum, quality and estimate revisions. The estimate revisions grade ranks companies by the statistical strength of their two latest quarterly earnings surprises and earnings revisions for the current fiscal year over the last month and three months.
Earnings estimates are a critical element to consider as investors look for stock ideas and manage their holdings.
Using the A+ Stock Grades Screener, you can isolate those companies that grade highly based on earnings estimates (along with growth, value, momentum and quality).
Now that we are nearing the end of the current earnings season, we can start to identify companies that have reported strong (or weak) earnings surprises and those seeing their consensus estimates revised (upward or downward).
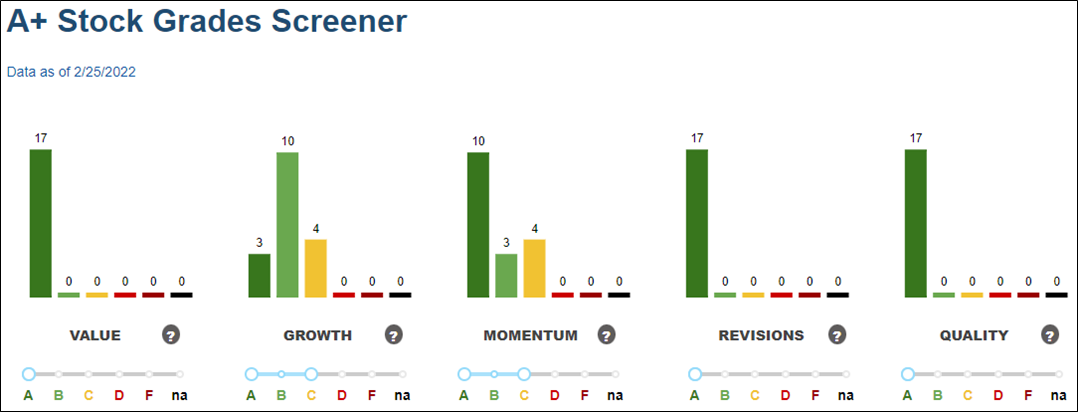
The A+ Stock Grades Screener allows you to filter for stocks with specific factor grades. As of the close on February 23, 2022, there were 245 stocks out of the universe of 7,076 companies with an estimate revisions grade of A.
However, this is still a large universe of companies to sift through. To begin narrowing down the universe even further, I first applied a filter of an A grade for quality. Currently, 1,154 companies in the A+ universe have a Quality Grade of A, while 67 have A grades for both revisions and quality.
Research from David Dreman and others shows that deep-value companies respond more favorably to significant positive earnings surprises and react less adversely to negative earnings surprises. Therefore, the next filter I apply looks for a value grade of A. This lowered the number of passing companies down to 19.
To round out this set of grade filters, I also required a minimum of C grades for growth and momentum, leaving us with 17 remaining companies.
This table shows the top 10 of the 14 passing companies based on their estimate revisions score.
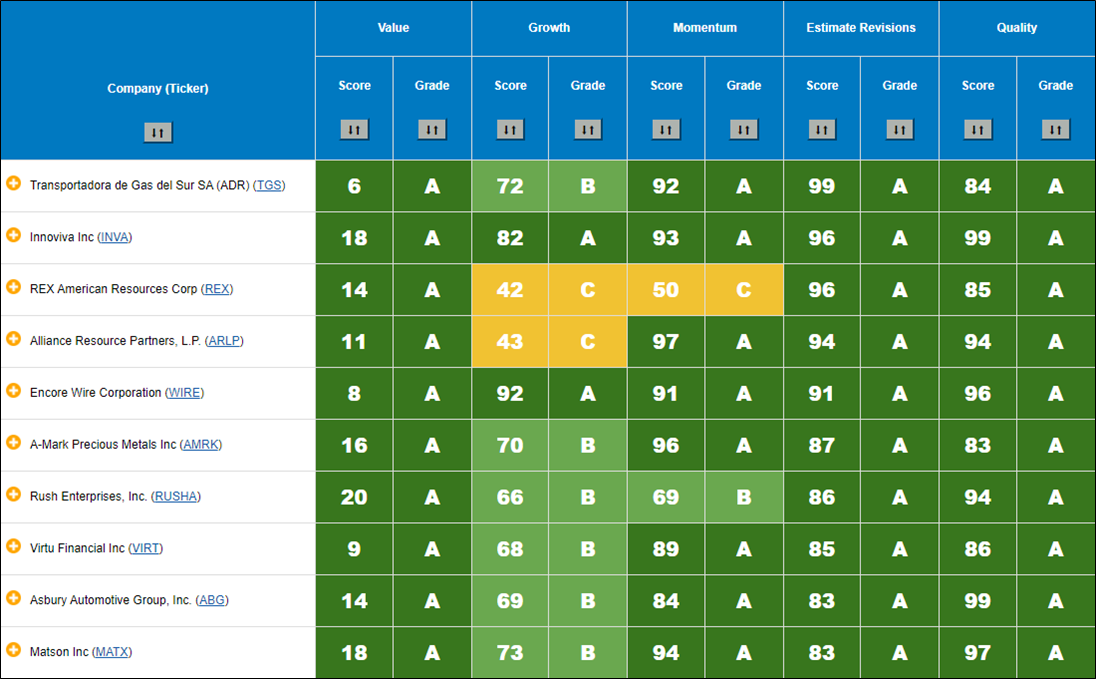
Two of the 17 companies passing the stock grades filters have A grades across all five factors: Innoviva Inc.  (INVA) and Encore Wire Corp. (WIRE).
Transportadora de Gas del Sur SA (TGS) has the highest estimate revisions score among these 17 companies at 99. The company has A grades across the board, except for a B grade for growth.
Clicking on the ticker for Encore Wire takes us to its Stock Evaluator page. From there, clicking on the Grades tab takes us to a detailed explanation of each of the five factor grades. For this example, we focus on Encore Wire’s estimate revisions grade:
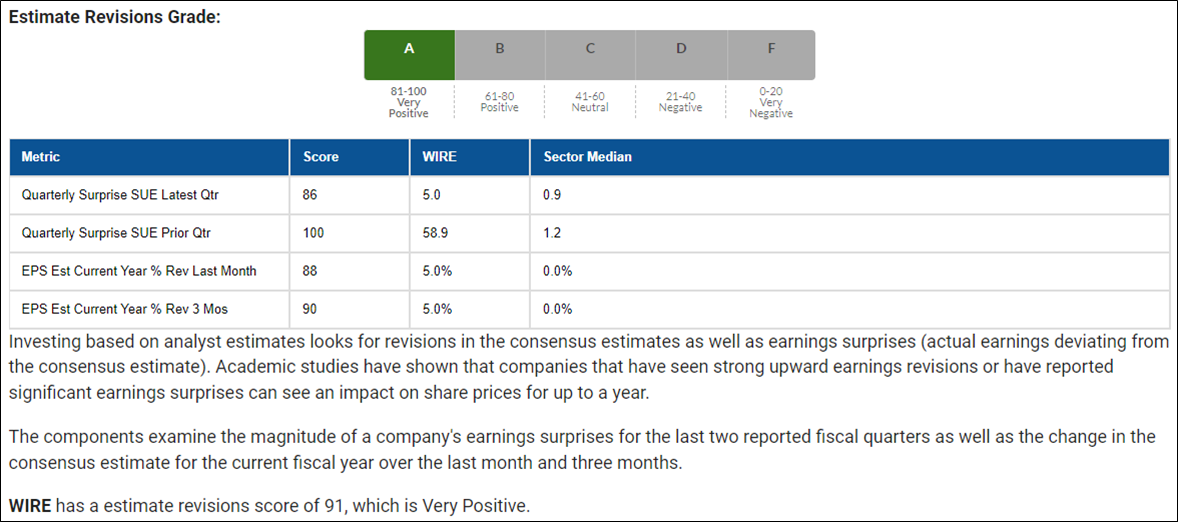
Encore Wire has an overall Estimate Revisions Score of 91, which translates into an A grade. This grade is arrived at by using four different pieces of data:
To say that a company missed or exceeded its quarterly consensus estimate does not necessarily capture the real significance of such an event. There are several ways of measuring the significance of an earnings surprise. One method of measuring the magnitude or significance of earnings surprises is the standardized unexpected earnings (SUE) score. SUE measures the earnings surprise in terms of its number of standard deviations above or below the consensus earnings estimate.
An earnings surprise is considered more significant the farther it is outside the statistical range of estimates expected at the time of the announcement. Assuming a normal distribution of earnings estimates, 68.2% of actual earnings will be within one standard deviation of the consensus estimate, 95.4% within two standard deviations and 99.7% within three standard deviations. The absolute value of SUE measures the degree of unexpected earnings. There is no earnings surprise when the SUE score equals zero; the actual earnings per share is in line with the consensus earnings estimate.
The standard deviation of Encore Wire’s estimates for its quarter ended December 31, 2021, was $0.75. The two analysts tracking the company were expecting earnings of $3.17 per share. Still, the company ended up reporting earnings of $6.91 per share. Dividing the difference between the estimates and actual earnings ($6.91 – $3.17) by the standard deviation of the estimates ($0.75), we arrive at a highly statistically significant SUE score of 5.0 for the latest quarter. The SUE score for the quarter ending September 30, 2021, was even more statistically significant at 58.9. In this case, the dispersion of estimates was much lower—$0.095 standard deviation—and the difference between forecasted earnings and reported earnings was much greater ($8.51–$2.915).
The consensus earnings estimate for Encore Wire’s current fiscal year ending in December stood at $10.373 per share as of February 25. One month ago, analysts were forecasting earnings for the year of $9.883 per share. The estimate three months ago was also $9.883. Using these numbers, we arrive at the percentage change over the last month and the previous three months of 5.0%.
The “raw” values of the four metrics used for the estimate revisions grade are then converted to percentile ranks, which compare them against all of the stocks in the universe. Encore Wire’s SUE score for the latest quarter of 5.0 ranks in the 86th percentile among the more than 7,000 stocks in the A+ Investor stock universe, while the 58.9 SUE score from the previous quarter ranks in the 100th percentile.
The percentage changes in the current year’s consensus estimate over the last month and three months rank in the 88th and 90th percentiles, respectively. The percentile ranks for the four underlying metrics are then averaged; for Encore Wire, this translates into an Estimate Revisions Score of 91, which places it in the A, or “very positive,” grade range.
While investing in companies seeing significant upward earnings revisions has been shown to generate promising results over the long term, it is essential to consider elements of financial strength, quality or price momentum. As an A+ Investor, not only can you evaluate the estimate revisions of individual stocks, but you can also use the Stock Grades Screener to isolate those companies with high estimate revisions scores along with elements of growth, momentum, quality and value.

