According to NYSE Arca, there were over 2,800 U.S.-listed exchange-traded funds (ETFs) in 2021. ETF.com reported that investors added the largest sum ever to ETFs during 2021: more than $900 billion. This shattered the previous record of $507.4 billion in 2020. According to FactSet, the U.S. ETF industry ended 2021 with $7.21 trillion in assets under management (AUM).
For all the talk about and money invested in ETFs, though, many investors are unsure of what these investment vehicles are. So in this installment of Making the Grade, we explain what ETFs are, how to use them and how you can use A+ Investor tools to focus your search for them.
ETFs are hybrid investment vehicles that can offer relatively low-cost and tax-efficient exposure to a variety of asset classes—equities, bonds and commodities—and investment strategies. Like traditional mutual funds, most ETFs invest in a diversified portfolio of stocks and bonds. However, ETFs differ from traditional mutual funds in that they trade on a stock exchange.
The majority of ETFs are passively managed, meaning they track an index. However, there is a growing number of ETFs that are actively managed. No matter whether an ETF is actively or passively managed, they tend to have lower annual expenses relative to mutual funds. But, because they trade like stocks, investors should account for transaction costs such as commissions and bid-ask spreads when buying and selling ETFs.
One benefit of ETFs is that they tend to be tax-efficient compared with traditional mutual funds. There are two main reasons for this. First, most ETFs are index funds. And index funds, especially large-cap index funds or total-market index funds that are weighted by market capitalization, have fairly low turnover. Low turnover means fewer opportunities to realize gains when securities are sold from the portfolio, which are taxed.
ETFs’ structure is the second driver of their tax-efficiency. ETF shares are created and destroyed via in-kind transactions between ETFs’ sponsors and a special kind of market maker known as an authorized participant. As such, ETFs tend not to have to directly sell positions from their portfolios to meet redemptions, which protects investors from taxable capital gains distributions.
However, it is important to distinguish between being tax-efficient and tax-free. ETFs tend to be the former, not the latter. The primary benefit of ETFs from a tax perspective is that they can allow investors to defer the realization of capital gains taxes. Investors in ETFs will still pay taxes on regular distributions of income, and they will also pay capital gains taxes when they sell an ETF for more than they paid for it. Also, some ETFs will distribute capital gains, but distributions tend to be less frequent and smaller than those of their mutual fund counterparts.
A+ Investor subscribers have exclusive access to a variety of ETF-related research and content.
To access the enhanced ETFs page, go to www.aaii.com/etfs or click on the ETF Ideas link underneath the Investing Ideas tab.
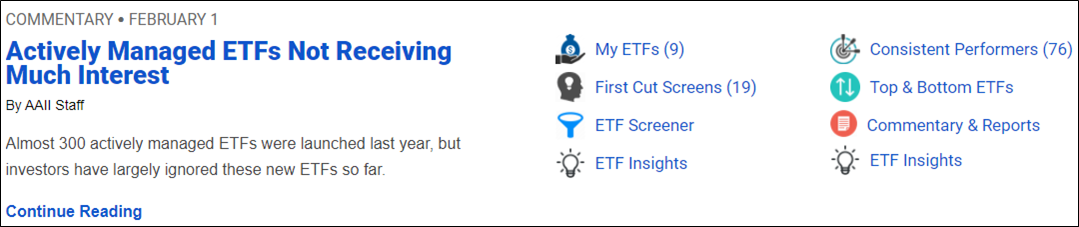
At the upper-right of the ETFs page, you will find several icons that offer direct access to ETF screeners, screening strategies, ETF data and information and ETF commentary and reports. In addition, there is an ETF comparison tool under this list near the top of the page.
The number in parentheses after My ETFs indicates how many ETFs you hold in any portfolio(s) you created in My Portfolio. If you click on this link, it takes you to your default (favorite) portfolio in My Portfolio.
Clicking on the Consistent Performers link takes you to a page with separate tabs that list the ETFs that have been consistent top performers or bottom performers over the last three, five and 10 years. Each of the columns in these data tables are sortable by clicking on the up/down arrows in the individual column headers.
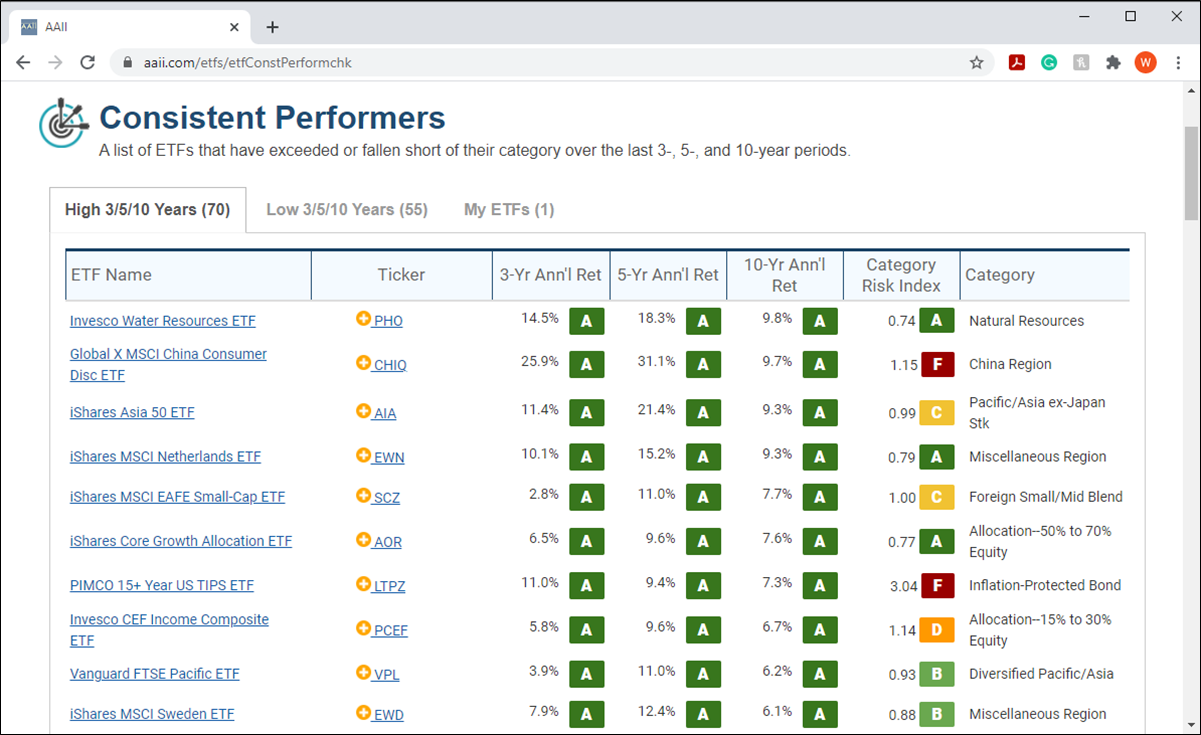
The number in parentheses after the tab name indicates how many ETFs have been tagged as consistent outperformers (or laggards). For each ETF, you can see how it outperformed or underperformed its category average for each time period.
The My ETFs tab on the Consistent Performers page lists any ETFs held in portfolios you saved that are a top or bottom performer over the last three, five and 10 years.
Clicking the First Cut Screens link on the ETFs landing page gives you a list of 19 (and growing) predefined ETF screens we have developed for A+ Investor.
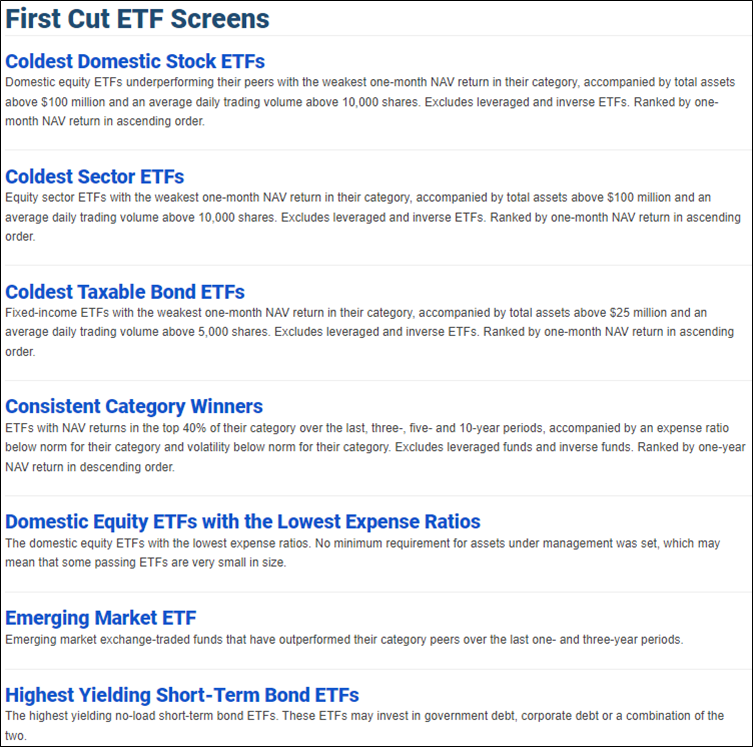
These screens will help you winnow down the entire ETF database based on pertinent ETF selection criteria. For example, some of First Cut screens look for the top and bottom domestic stock, sector and taxable bond ETFs. Selecting any of the First Cut ETF Screens will open the ETF Screener at the current listing of ETFs meeting that screen’s criteria.
Clicking the Top & Bottom ETFs link on the ETFs landing page takes you to a listing of the best- and worst-performing ETFs among U.S. equity ETFs, international equity ETFs, sector equity ETFs and fixed-income ETFs. You can choose from several performance periods, including one-year, three-year, five-year and 10-year.
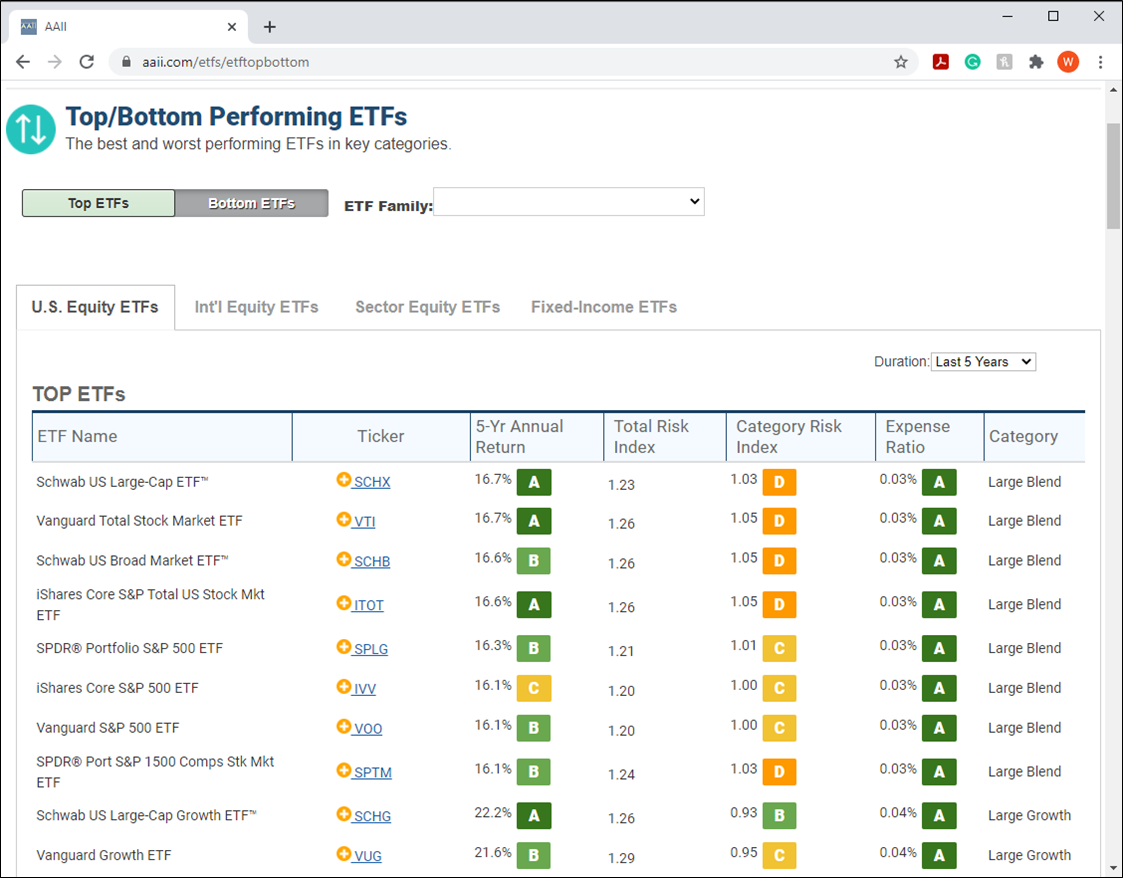
From the Top/Bottom ETFs page, you can toggle between bottom and top ETFs. In addition, you can choose a specific ETF family to see whether any of their offerings are a top or bottom performer.
The ETF Screener link (www.aaii.com/screens/etf) takes you to the ETF+ Screener built exclusively for A+ Investor.
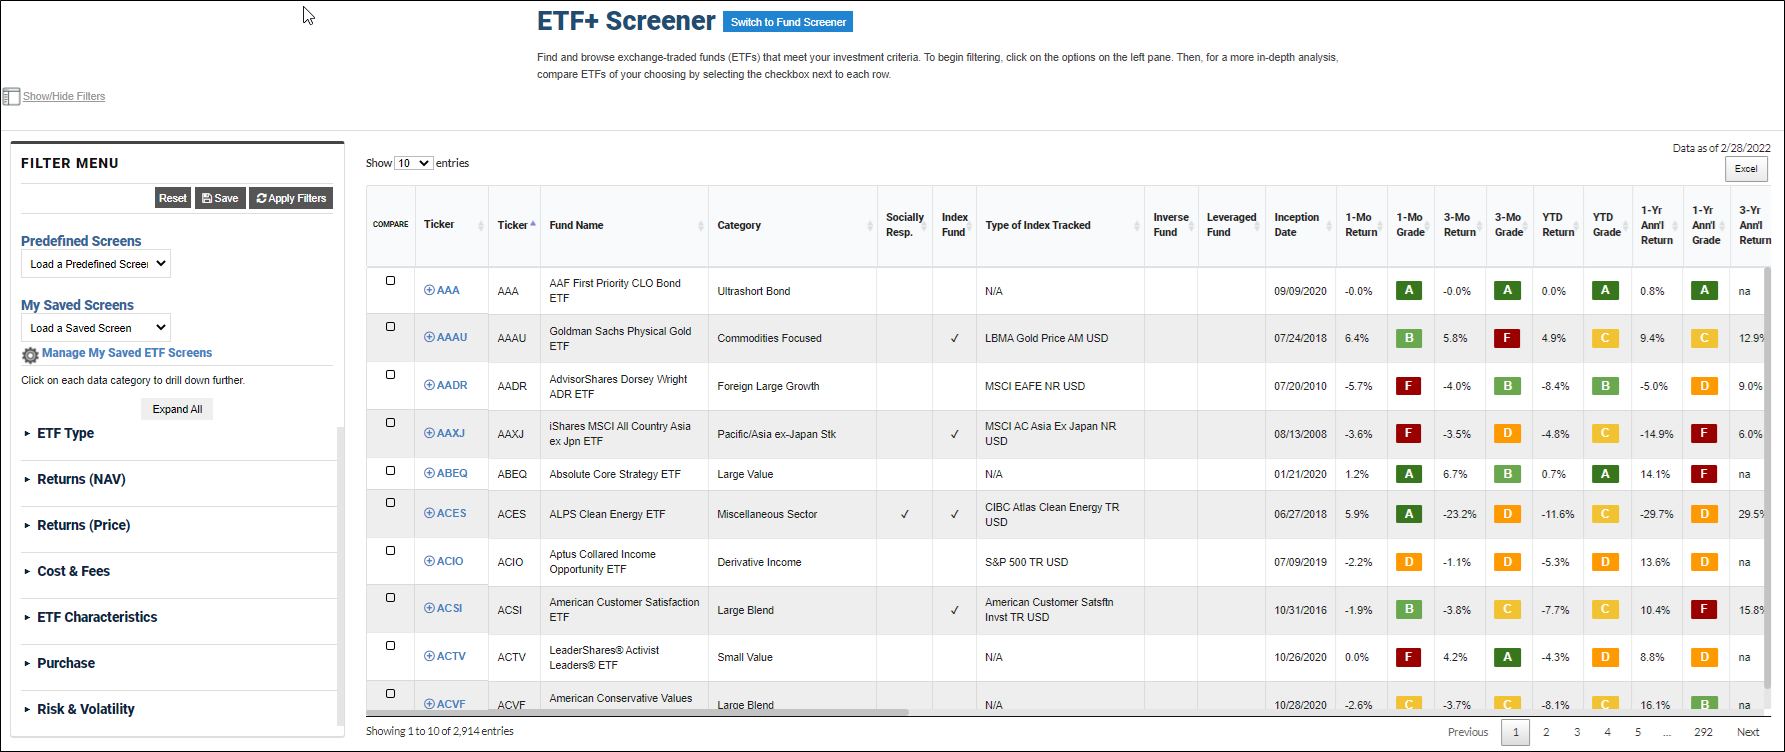
The ETF screener allows you to:
The ETF screener’s filters are divided into several categories:
Clicking on an individual data category expands that specific one, or you can click on the Expand All button to show all of the filters you have at your disposal.
As you add filters, those you are using are listed at the top of the screen.
When you are finished creating your screen, click the Apply Filters button at the top-left of the page to see the list of ETFs currently passing your filters.
To use a screen again at a later time, click the Save button next to the Apply Filters button. At that window, you are prompted to provide a name and a description for your ETF screen, and then you click the Save button at the bottom-right of the save window. You can save up to 25 of your own ETF screens.
Once you save a screen, you can access it from the My Saved Screens drop-down menu on the left side of the page.
We have also created 19 predefined ETF screens, which you can access from the Predefined Screens drop-down menu. These predefined screens include:
Selecting a screen from this list loads the passing ETFs in the table and displays the underlying criteria above the passing ETF listing. Clicking on an “x” next to any of the selected screening criteria will remove it from the screen. You can then click the Apply Filters button to update the list of passing ETFs as well as click the Save button. You cannot overwrite a predefined screen, but you can name it using a new name, at which point it will be available from the My Saved Screens drop-down menu.
You can rename, delete and add/revise a description for any of your personal ETF screens by clicking on the Manage My Saved ETF Screens button. From that page, change the Screen Name or Description and then click the Save button to retain your changes.
You can compare multiple ETFs that pass a given screen. Click the box in the Compare column of the ETF screener for those funds you wish to compare and then click on the Compare at the bottom of the page. Alternatively, from the ETF Ideas page you can type the tickers of ETFs you want to compare into the Compare box.
The resulting comparison grid provides a select number of essential data points, including category, inception date, performance data for a number of time periods, category risk, turnover and expense ratio.
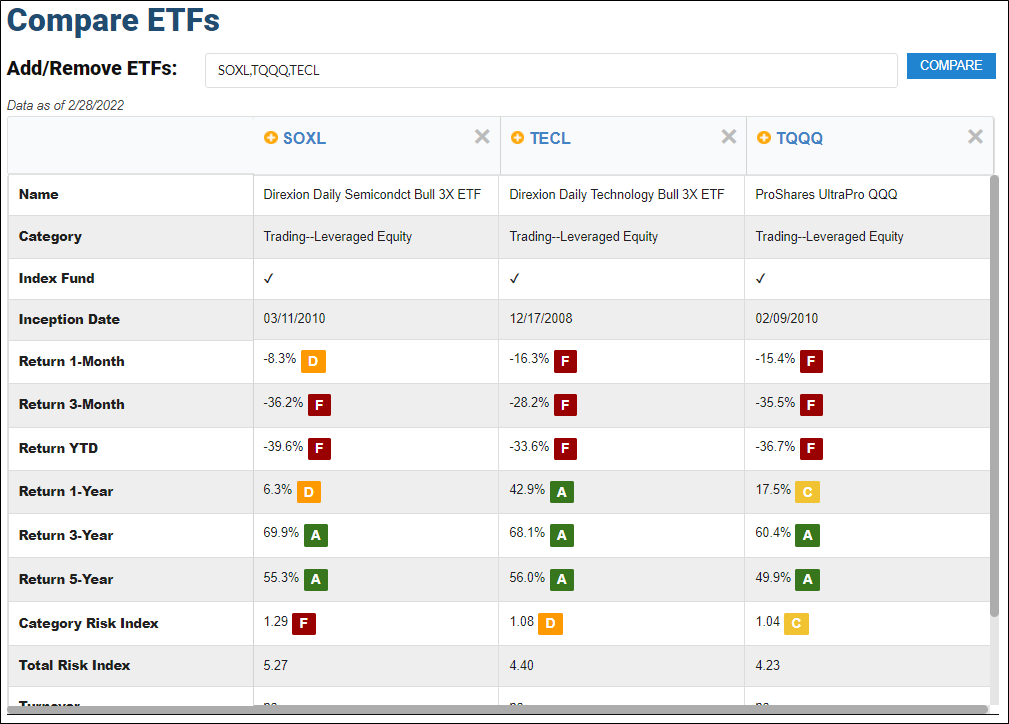
From the comparison table, you can also add an ETF to an existing portfolio/watchlist by clicking on the plus sign in front of the ETF ticker.
Back at the main ETF Ideas page, the Commentary & Reports link will allow you to see AAII articles related to ETF investing, analysis and research.
Scrolling down the page, the Featured ETF First Cut table displays a First Cut list with five ETFs ranked by one-month return in descending order, based on the latest ETF data AAII has received.
The Top/Bottom Performing ETFs table displays the five best- and worst-performing ETFs in key categories, including U.S. equity ETFs, international equity ETFs, sector equity ETFs and fixed-income ETFs.
The Consistent Performers table is a list of ETFs that have exceeded or fallen short of their category over the last three, five and 10 years. The High 3/5/10 Years tab displays funds that have consistently outperformed their category, while the Low 3/5/10 Years tab displays underperformers. The My ETFs tab lists any ETFs held in portfolios you saved that are a top or bottom performer over the last three, five and 10 years.
The Manager Changes Table highlights those ETFs that have added or dropped managers.
For any of these tables, click See all at the bottom of the table to open an expanded table showing all results for the list.
Finally, the Articles section at the bottom of the page highlights recently written ETF content from the AAII Journal and AAII webinar videos related to ETFs.

