The custom stock screener that is an exclusive benefit to A+ Investor subscribers allows you to build stock screens based on data elements such as growth, valuation, earnings estimate revisions, stock performance and more. With it, you can easily and quickly identify stocks that meet fundamental criteria that matter most to you when selecting stocks.
This tool complements the popular Stock Screens and the A+ Stock Grades Screener, which lets you identify stocks based on investment factors focused on value, momentum, quality, growth and estimate revisions and surprises.
You will find the link to the Custom Stock Screener on the A+ Investor dashboard page (www.aaii.com/plus):
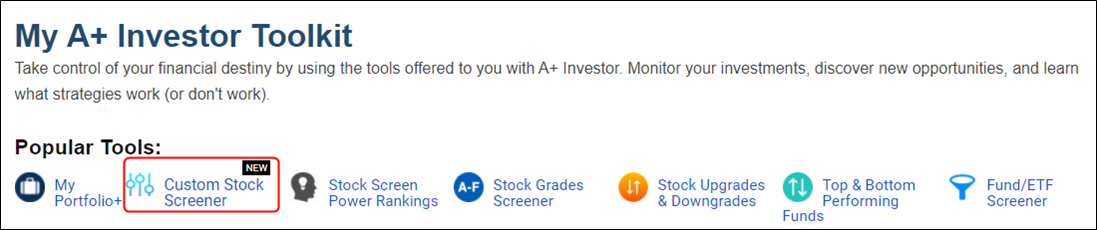
You can also bookmark this page to take you directly to the custom stock screener: www.aaii.com/stockideas/customscreener
I prepared a short intro video that walks users through creating a stock screen, which you can access here.
The video offers a nice overview of the screener, but I also want to discuss some of its key features here.
With the custom stock screener, you build screens in two steps.
Selecting Your Filters
First, you select the filters you wish to use with your screen. When you add filters, you are given all of the screening filters (data fields) currently built. This image is only a fraction of the 70+ fields the stock screener currently offers:
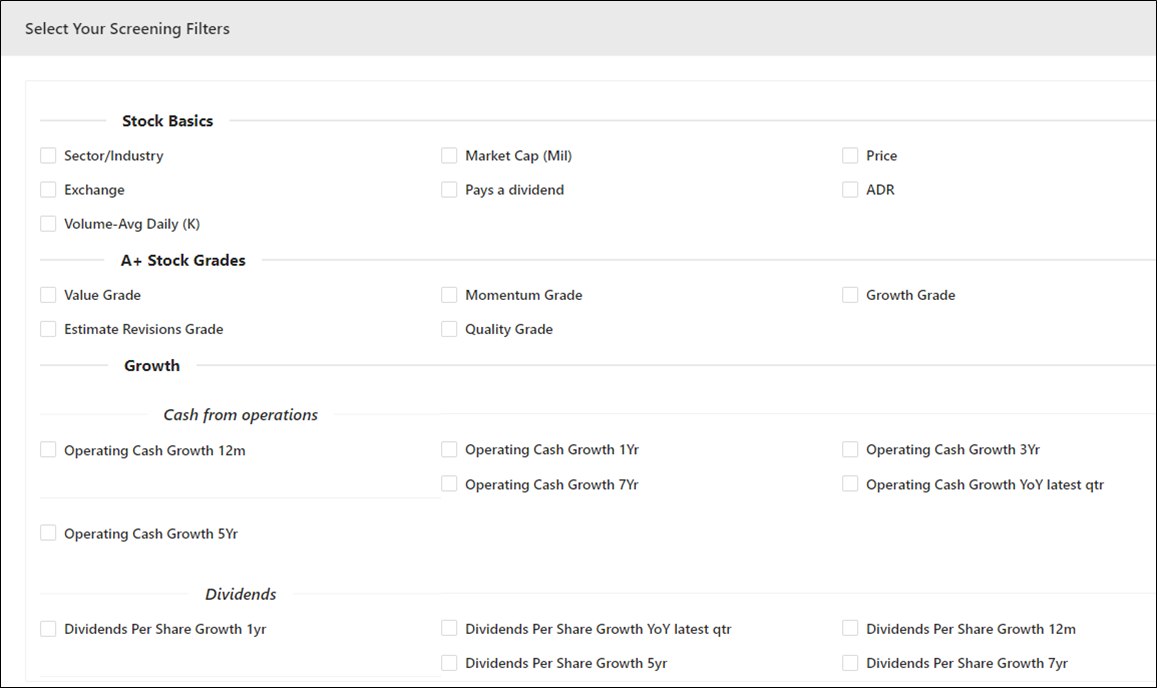
The filters are divided into data categories:
From the “Select Your Screening Filters” window, click the checkboxes to the left of any of the data fields you want to use for your screen.
Once finished, click the “Adjust Filters” button at the bottom right of the window to proceed to the next step.
Adjusting Your Filtering Parameters
After selecting the filters for your screening, the second and final step is to adjust the parameters for the fields you chose. In effect, you specify the characteristics you are looking for in the stocks that pass your screen.
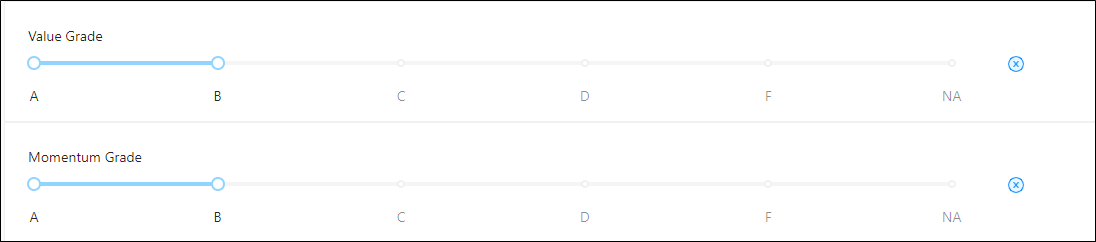
You adjust the minimum and maximum range used for each filter with slider bars. Click on the white dot at either end of the slider bar and drag it to adjust to the desired range.
For example, if you select one A+ Stock Grade for your screen and want to isolate stocks with a grade of A or B, you drag the dot from the left so that the A to B range is highlighted:
Screening on Absolutes or Percentile Ranks
For numeric fields, you have the option of filtering based on the field’s absolute value or its percentile rank. You can toggle between filtering based on “Absolute” or “% Rank” by clicking the blue button for the specific field.
By default, % Rank is the initial filtering option. But let’s say you want to screen for companies with a positive average annual dividend growth rate over the past three years. After selecting Dividends Per Share Growth 3yr from the filters list, you click the toggle button to screen for Absolute and then drag the slider dot from the left until the minimum range is 0 (zero):

Percentile ranks show how a company stacks up against all the companies in the A+ Investor stock universe. Percentile ranks are helpful because they adapt as market and economic conditions change. Depending on where we are in the market and economic cycle, for example, a price-earnings ratio of 10.0 may be high or low. But if you are looking for low price-earnings stocks, you can use the percentile rank to focus on the companies in the bottom 25% of the stock universe. While the absolute value that denotes the cutoff will change over time, you are always looking for the bottom 25% of stocks:

Estimated Results
As you adjust the screening parameters of the fields you’ve selected for your screen, you will notice that the “Estimated Results” number at the top-right of the screening window will change. This tells you how many companies pass the screen you are building with the current parameters you’ve established.
This is useful to see if the screen you are building is too restrictive (too few or no passing companies) or not restrictive enough (too many passing companies).
Adding & Deleting Filters
As you build a screen, you can remove and add filters.
To delete a filter from the screen you are working on, click on the blue “X” at the bottom-right of that filter field.
If you want to add filter fields to your screen, click the “Add Filters” button at the top-right of the screening window to return to the “Select Your Screening Filters” window, where you can select additional filters. You will need to click the “Adjust Filters” button again to adjust the parameters for any new fields you choose.
Applying Filters & Viewing Screening Results
Once you have finalized your screening parameters, the final step is to run it to view the passing companies. You can do this by clicking the “Apply Filters” button below the Estimated Results total.
When you apply your screen, the passing companies are displayed in the data table at the bottom of the page. Here you can view a variety of data for the passing companies, grouped by similar data types:
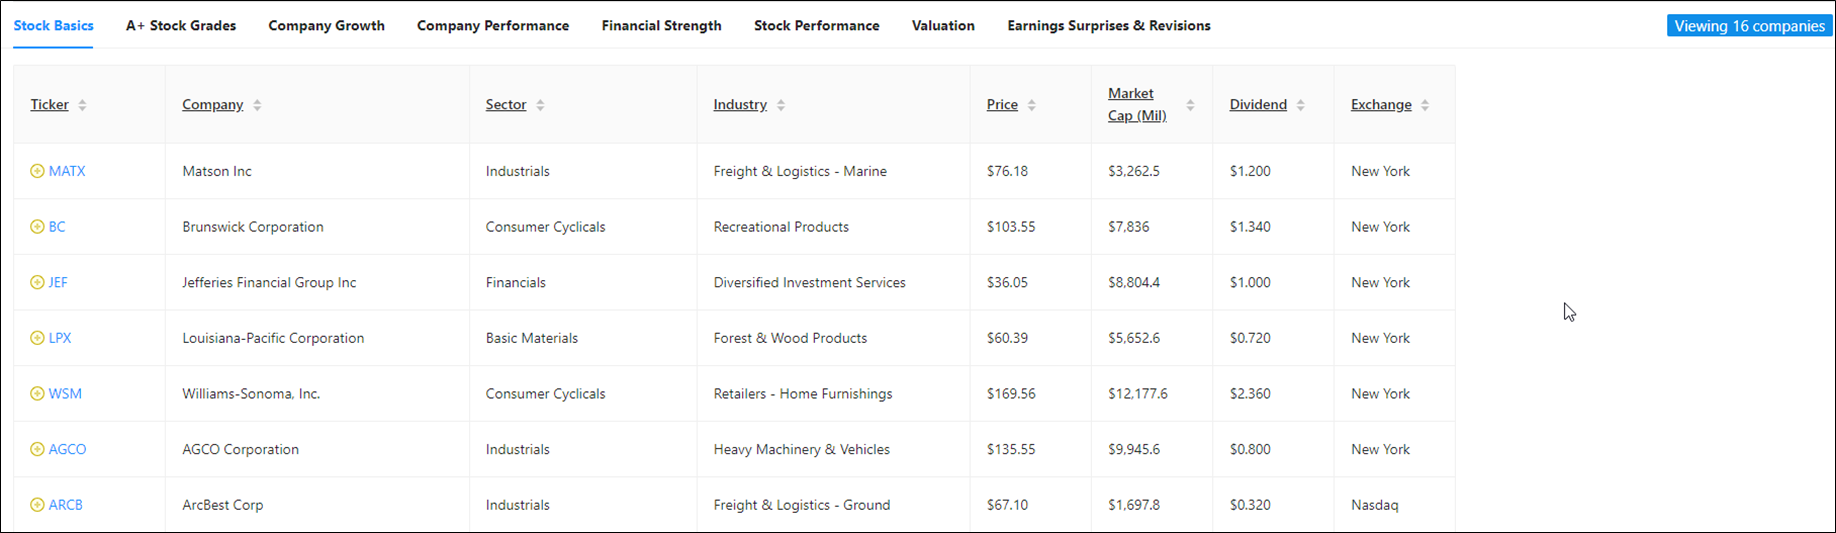
You can navigate between the different data tabs by clicking the data categories (Stock Basics, A+ Stock Grades, Company Growth, etc.).
Furthermore, you can sort a given tab by an individual data field by clicking on the data header.
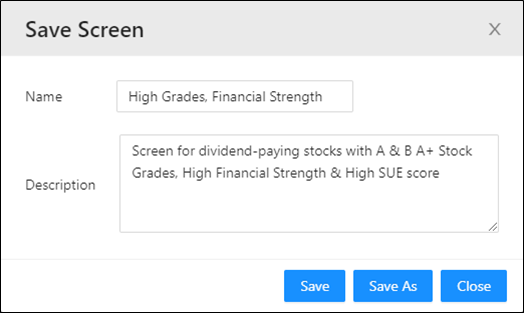
Once you have created a screen, you can save it for future use. To save a screen, click the “Save” button at the top-right of the screener page.
You can name the screen as well as provide a description:
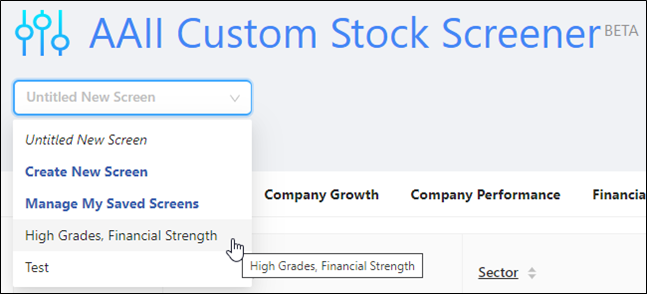
You can load saved screens from the drop-down menu on the top-left of the screener page:
A+ Investor subscribers can also load the results of an AAII Stock Screen from the custom stock screener.
From the drop-down menu at the top-left of the screener page (where you can also select screens that you have created and saved), scroll down to the AAII Stock Ideas. There you will find the 50-plus stock screens that AAII tracks. Selecting one of the screens will load the companies that pass the criteria of the screen as of the close of the previous trading day.
For example, selecting the Neff screen loaded the 19 companies that passed as of the close on Friday, April 1, 2022:
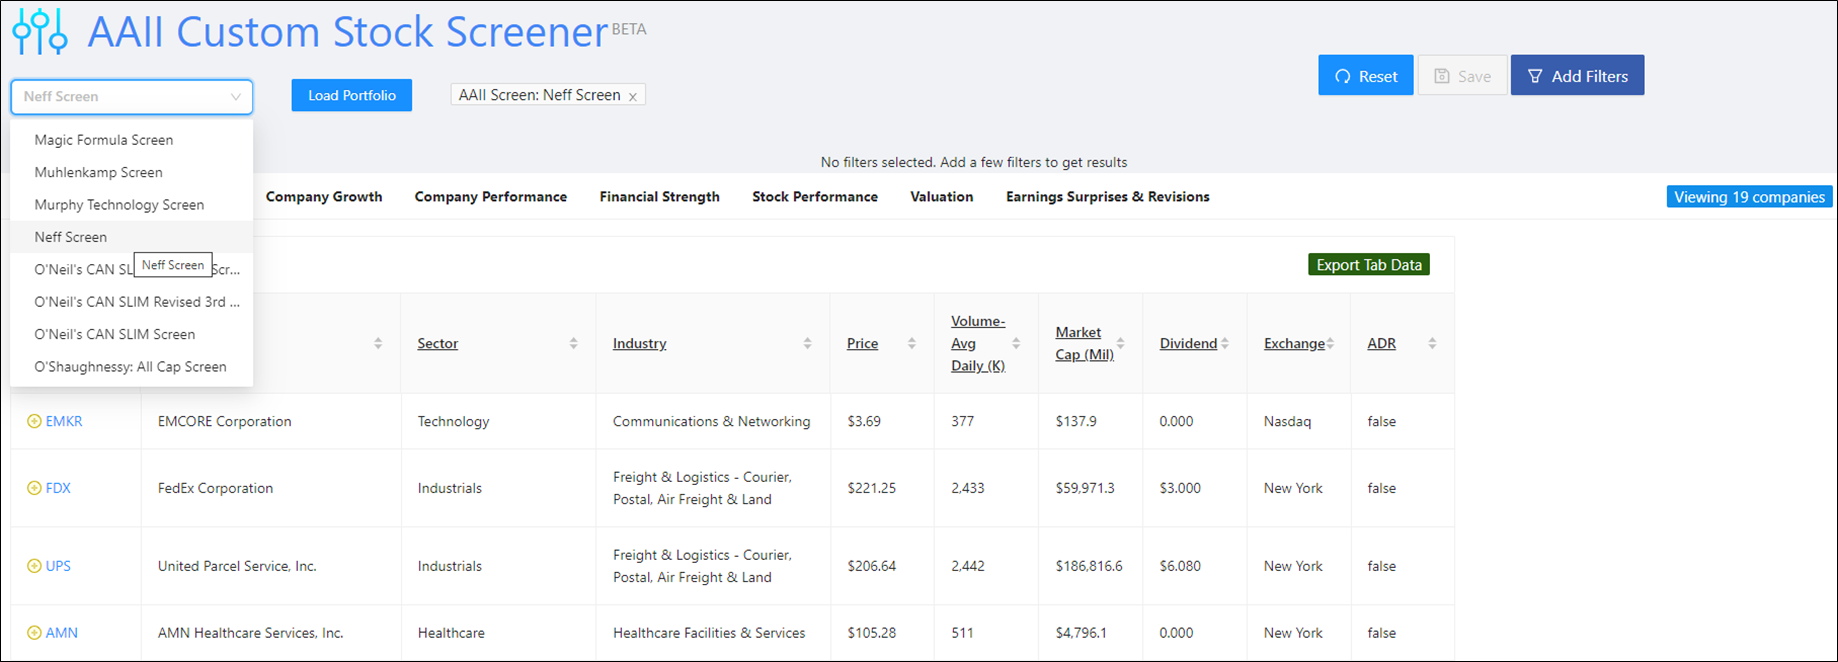
As A+ Investor subscribers, the results of these screens are updated daily, Tuesday through Saturday, as of the previous trading day’s close.
You can also run custom screens against the stocks that pass any of the AAII Stock Screens. This is especially useful if many companies are passing and you want to narrow down the number even more.
For example, if you select the Estimate Revisions Up 5% screen, which looks for companies whose consensus estimates have risen by 5% or more, you will see that 124 stocks passed as of April 1, 2022. You know if the results of an AAII Stock Screen are loaded because the name of the screen will appear to the right of the Load Portfolio button.
Clicking the Add Filters button allows you to add additional screening filters. You can also apply the filters of a saved custom screen from the drop-down menu. When you do this, the name of the applied saved screen will appear in the drop-down menu.
In this example, I added filters that require A+ Value and Quality grades of B or better and a Piotroski F-Score (a measure of financial strength) of 7 or higher (on a nine-point scale). Be sure to click the Apply Filters button after selecting any additional filters to run them against the results of the loaded AAII Stock Screen. These additional filters reduced the 124 companies passing the Estimate Revisions Up 5% screen to four as of April 1, 2022:
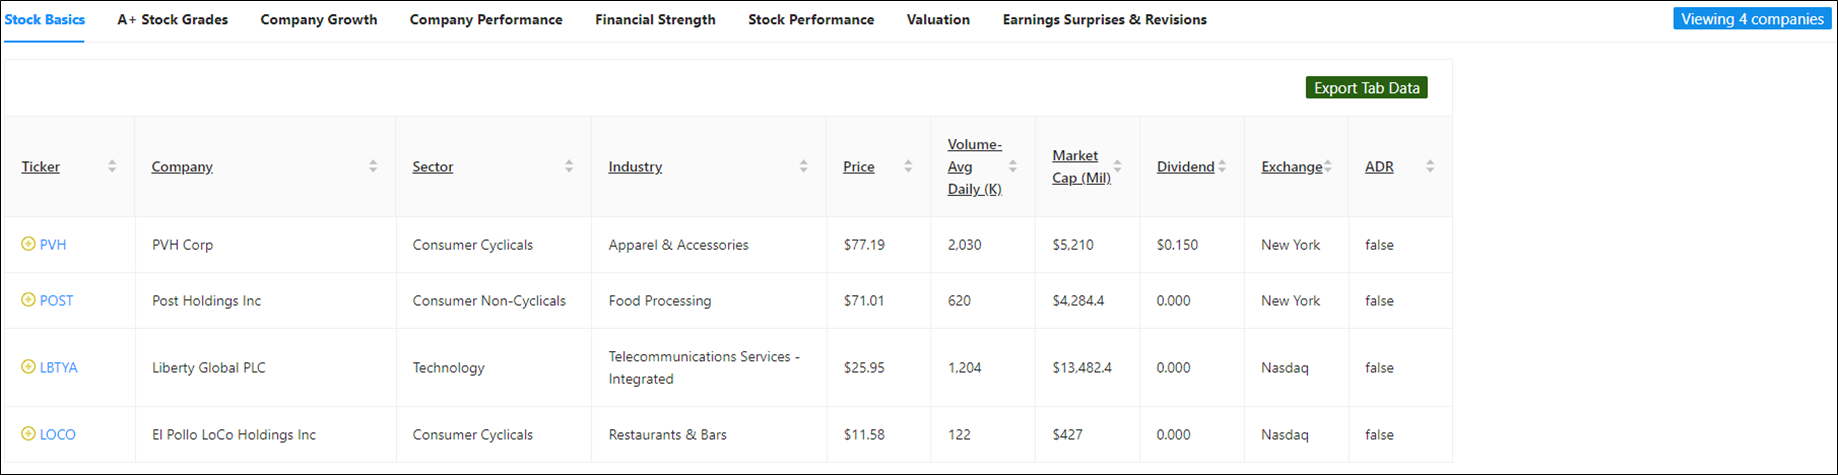
To “unload” a selected AAII Stock Screen, either click the “X” next to the screen name to the right of the Load Portfolio button or click the Reset button at the top-right of the custom stock screener window.
In a similar fashion to running custom screens against the results of AAII Stock Screens, you can also run custom screens against any stocks held in portfolios you created in the My Portfolio tool. [Note that you currently cannot run AAII Stock Screens against a portfolio, but we are working on that as a future enhancement.]
To load a portfolio, click the Load Portfolio button. This will bring up the list of all of the portfolios you’ve created with My Portfolio:
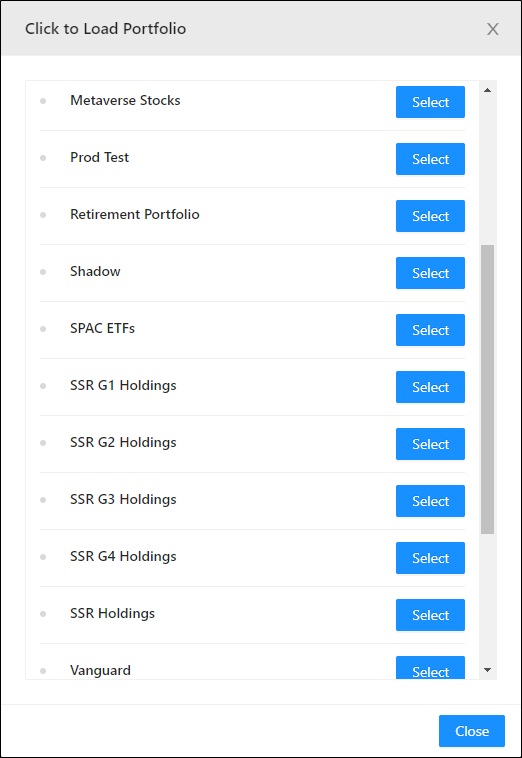
Click the Select button to the right of the portfolio you wish to load. However, remember that any portfolio you load will need at least one stock ticker since the screen can only filter through stocks. The name of a selected portfolio will appear in the box next to the Load Portfolio button at the top of the screener window.
Here I loaded my Retirement Portfolio, which holds five individual stocks:
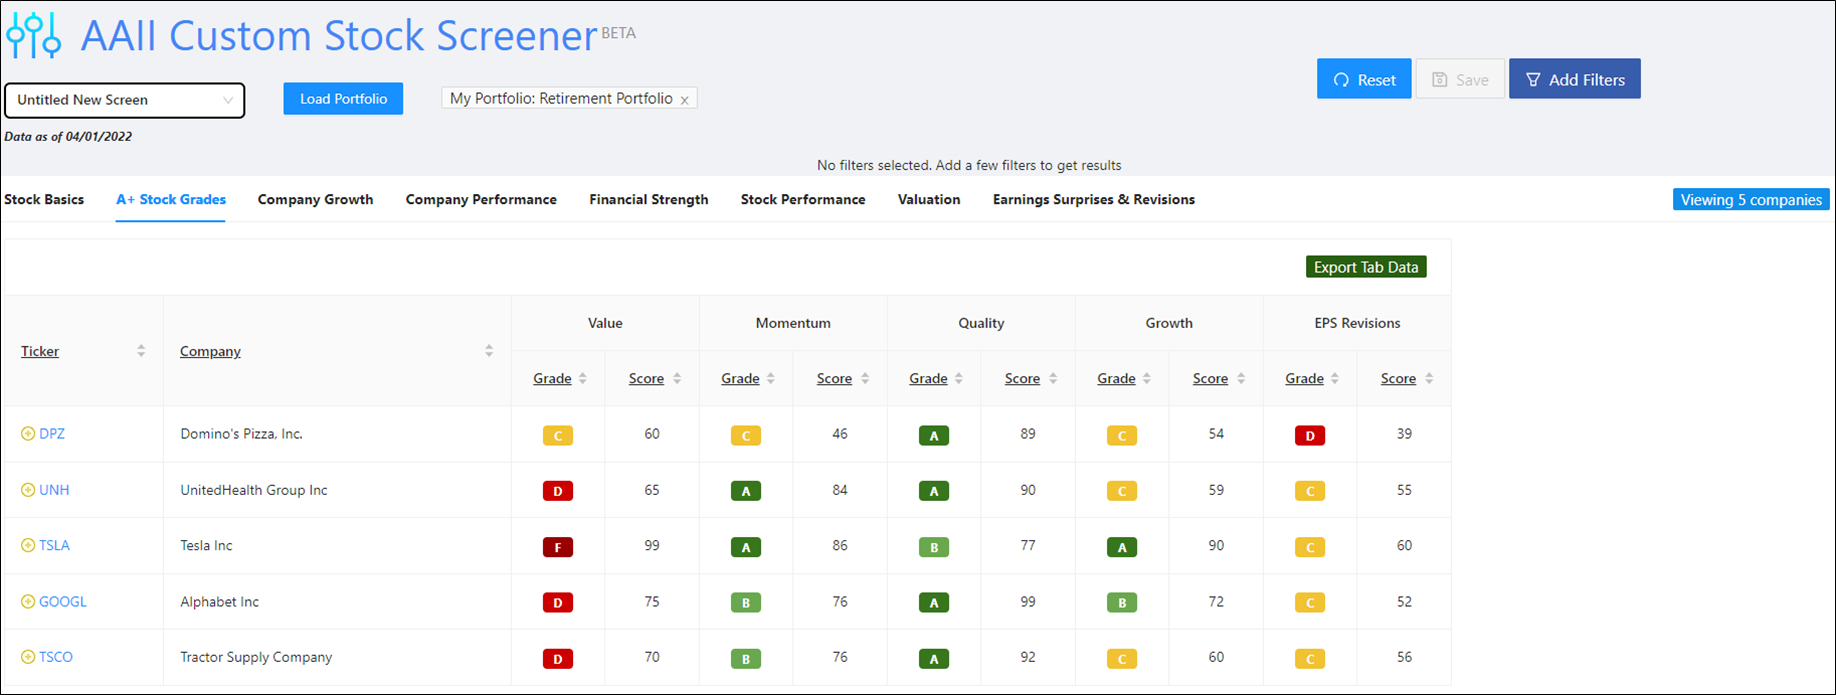
Loading a portfolio also allows you to view select performance and financial data on the different tabs of the results area for the stocks in the loaded portfolio. For example, in the image above, I view the A+ Stock Grades tab for the four stocks in my Retirement Portfolio.
To run filters against the stocks in the loaded portfolio, once again click the Add Filters button or select a saved screen from the drop-down menu.
Whether you add filters to run against the stocks in a loaded portfolio or select a saved screen, you need to click the Apply Filters button to run the screening filters against the stocks of the loaded portfolio. Depending on the number of stocks in the loaded portfolio and how restrictive the screening parameters you select are, you could end up with No Results (no passing companies).
To “unload” a selected portfolio, either click the “X” next to the portfolio name to the right of the Load Portfolio button or click the Reset button at the top-right of the custom stock screener window.
If you wish to add tickers from a stock screen to a new or existing portfolio in My Portfolio, click the yellow “+” button next to a ticker on the results table. After clicking the “+” button to add a stock to a portfolio, you have the option of selecting a preexisting portfolio, or you can type in the name of a new portfolio and click the Create Portfolio button.
Any portfolios you create within the custom stock screener will also be accessible from the main My Portfolio tool.
To allow users to save and further manipulate select financial data for the stocks in the A+ Investor universe, there is an export button for each data tab of the results table of the custom stock screener:
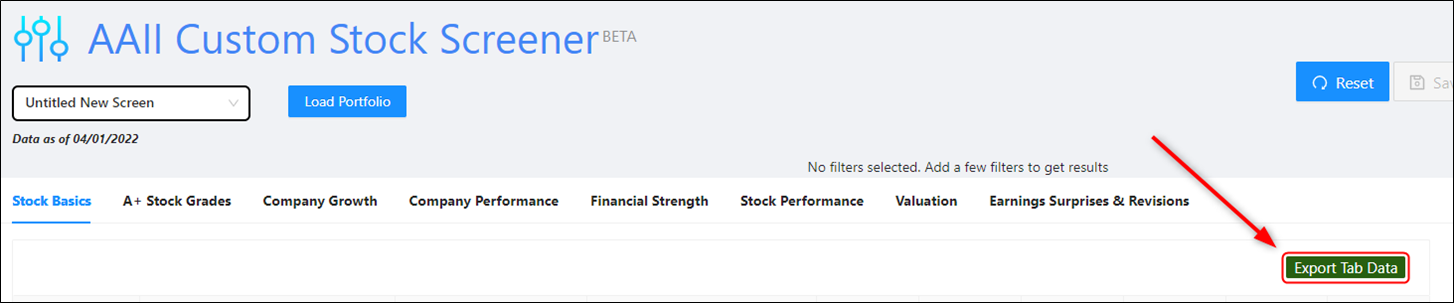
Whether you want to export data from a given data tab for the entire stock universe, the stocks in a loaded portfolio or the results of a custom screen or an AAII Stock Screen, click the green Export Tab Data button. This will download an Excel spreadsheet with the data fields of the “active” stock universe for whichever data tab you are viewing.
The name of the spreadsheet file you download will be the data tab you are exporting and the date of the current data.
We will continue to improve and enhance the custom stock screener based on user feedback, so be sure to tell us what you think by using this feedback form.

