 RCMT
RCMT
The U.S. stock market just experienced its worst month since the beginning of the coronavirus pandemic in March 2020. The tech-heavy Nasdaq composite lost more than 13% in April 2022, its worst showing since October 2008. Through April 29, the Nasdaq is down 21% for the year, its worst start to a year since its launch in 1971. The Nasdaq has also fallen nearly 24% since reaching a new all-time high on November 22, 2021.
The broader S&P 500 index shed nearly 9% in April, bringing its year-to-date losses to almost 14%. This marks its worst start to the year since World War II, according to CFRA Research. The Dow Jones industrial average fell 4.9% in April and is down more than 9% this year.
Historically, a bad April has the potential to spook traders and investors on the outlook for the rest of the year. More storm clouds are forming on the horizon as we enter the second trimester of 2022: The U.S. economy unexpectedly contracted 1.4% in the first quarter. Inflation in March jumped to 8.5%, although the narrower personal consumption expenditure price index showed signs of slowing.
Adding to market volatility are signs that the Federal Reserve intends to fast-track interest rate hikes to rein in inflation. This week, the Federal Open Market Committee (FOMC) will hold a two-day policy meeting. Fed chair Jerome Powell signaled a 50-basis-point increase at the end of the meeting on Wednesday.
Internationally, last week Russia cut off fossil fuel exports to Poland and Bulgaria, upending energy prices. In China, health officials have instituted near total lockdowns in Beijing and Shanghai, the country’s two largest cities, to combat rising coronavirus case rates. This places additional stress on global supply chains.
In the realm of investing, a factor is any characteristic that helps explain the long-term risk and return performance of an asset. Over the years, researchers have identified several factors that have historically demonstrated excess market returns over the long run.
The quality factor is described in academic literature as capturing companies with durable business models and sustainable competitive advantages. Quality is categorized as a “defensive” factor, meaning it has tended to benefit during periods of economic contraction. While the quality factor has a broader definition compared to others such as value and momentum, most “high-quality” strategies target companies that tend to have high returns on equity (ROE), stable earnings and strong balance sheets with low financial leverage.
AAII’s A+ Quality Grade is the percentile rank of the average of the percentile ranks of return on assets (ROA), return on invested capital (ROIC), gross profit to assets, buyback yield, change in total liabilities to assets, accruals, Z double prime bankruptcy risk (Z) and F-Score. The score is variable, meaning it can consider all eight measures or, should any of the eight measures not be valid, the remaining measures that are valid. To be assigned a Quality Score, though, stocks must have a valid (non-null) measure and corresponding ranking for at least four of the eight quality measures.
Research confirms that momentum is as significant a characteristic to seek in a stock as value, size or volatility. Momentum is not merely for short-term traders and those who rely on technical analysis, but also for those who focus on fundamental analysis.
Price momentum is normally measured by comparing the price change of a stock over a specified period relative to a benchmark, such as the S&P 500, or against a segment of stocks; the resulting number is called relative strength.
Relative strength has grown in popularity as a characteristic used in selecting stocks. A number of research studies and successful investors have highlighted the benefit of seeking out stocks with high relative strength, especially when combined with other fundamental selection characteristics, such as size and value.
Price momentum is often used as a signal that the market has recognized that the stock price is reacting to the investing concept. Investors look for stock price performance better than that of other stocks in the belief that the rising price will attract other investors, which will drive up the price even more. Relative strength’s utility is built on the belief that it persists over time. Momentum is considered to be an anomaly because if the market was pricing in all known information, then a stock’s future returns shouldn’t be influenced by past returns.
In “What Works on Wall Street” (McGraw-Hill, 2011), James O’Shaughnessy’s findings show a performance advantage to using both six- and 12-month relative strength. In both cases, stocks with relative strength in the top 30% or higher had annualized returns of approximately 12% or higher versus 10.5% for his all-stock universe. O’Shaughnessy’s data is for the period of 1927 through 2009. Other studies show a performance advantage to using 13-week relative strength as well as the aforementioned time periods.
There are several ways to measure the price performance of a stock, typically on either an absolute or a relative basis. Price change over a specified period is an example of absolute performance, while relative performance communicates how well a stock has performed compared to some benchmark, usually a market or industry index. The most basic means of calculating relative strength is by dividing the percentage price change of a stock over some time frame by the percentage change of a market index over the same period.
The A+ Investor Momentum Grade uses the weighted four-quarter relative strength price change for each of the past four quarters to rank companies. The most recent quarterly price change is given a weight of 40% and each of the three previous quarters are given a weighting of 20%.
A+ Investor subscribers have exclusive access to the A+ Custom Stock Screener. This screener allows A+ Investor subscribers to run more than 70 filters on a universe of more than 7,000 U.S.-listed stocks. You can build stock screens based on data elements such as growth, valuation, earnings estimate revisions, stock performance and more. With it, you can easily and quickly identify stocks that meet fundamental criteria that matter most to you when selecting stocks.
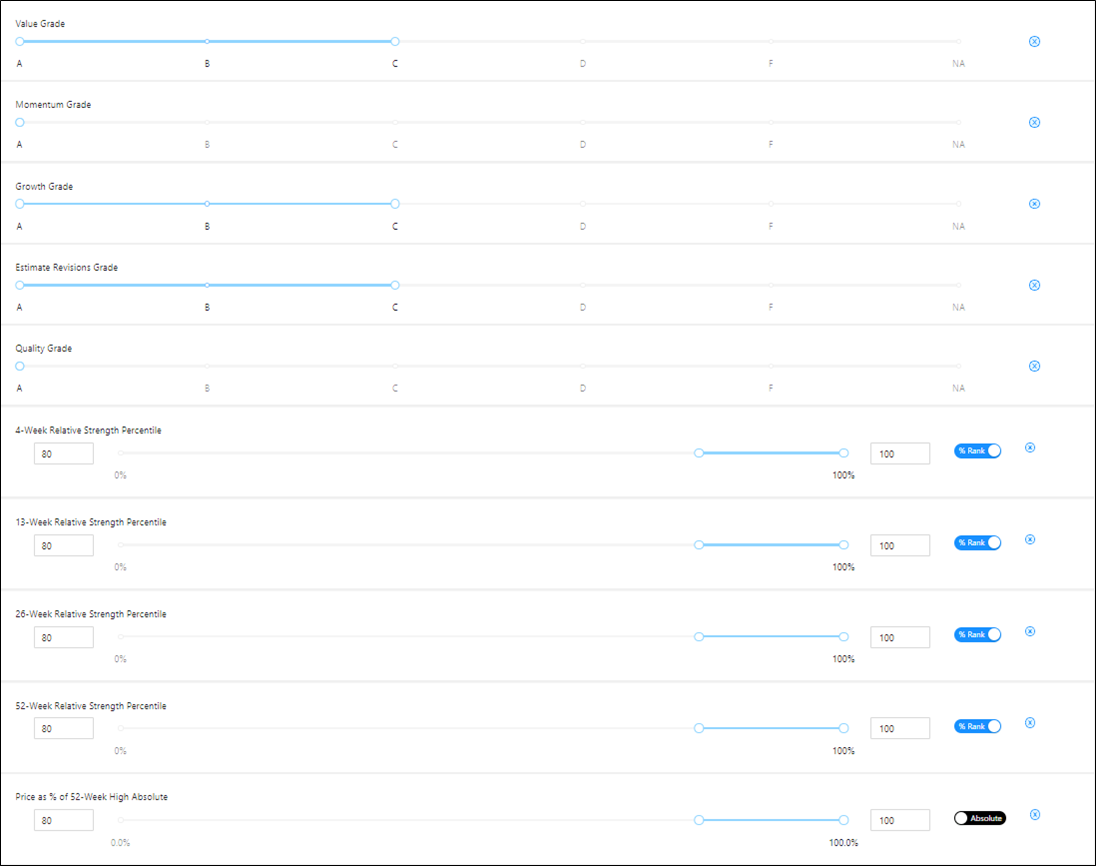
To identify high-quality companies whose stocks are exhibiting strong and consistent strong price momentum, I used the A+ Custom Stock Screener to first isolate stocks with A+ Momentum and Quality Grades of A.
I also required that stocks have grades of C or better for the other A+ factor grades—Value, Estimate Revisions and Growth.
To ensure consistent relative price strength, I also required passing stocks to rank in the top 20% of the entire stock universe for relative strength over the past four, 13, 26 and 52 weeks.
Lastly, passing stocks must be trading within 10% of their 52-week high as of the close on Friday, April 29.
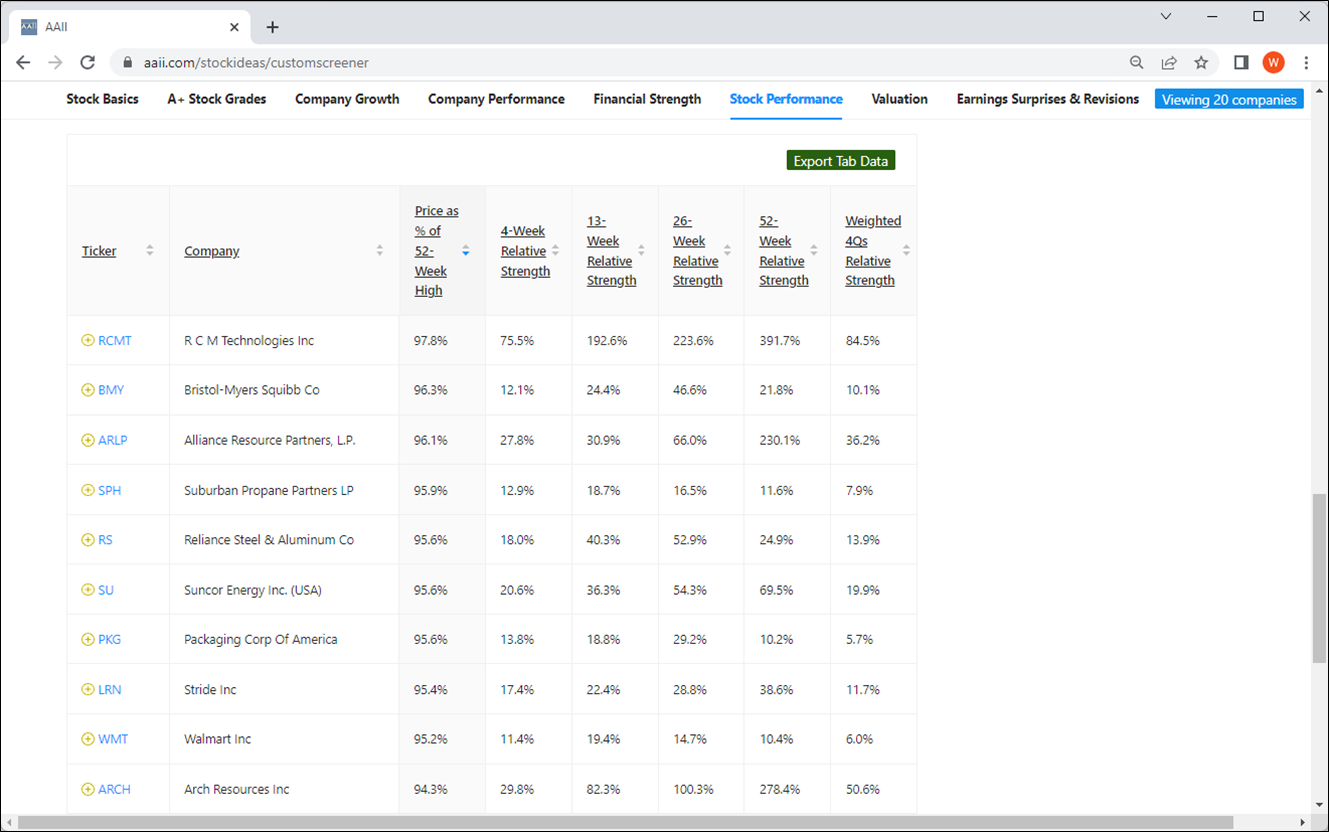
As of April 29, 20 companies met these requirements. The 10 stocks trading closest to their 52-week high are listed here:
RCM Technologies Inc. (RCMT) is trading the closest to its 52-week high as of the close on April 29. The company provides business and technology solutions through the deployment of engineering, specialty health care and information technology services. Its engineering segment provides engineering and design services; technical writing and digital documentation across marine, locomotive, transportation and aerospace markets; engineering, procurement and construction management (EPC); and demand side management/energy conservation services. The specialty health care segment provides staffing solutions of health care professionals, nurses, paraprofessionals, physicians and therapists and teletherapy services. The information technology (IT), segment provides enterprise business solutions, application services, infrastructure solutions, life sciences solutions and other vertical specific offerings.
RCM Technologies’ shares were trading within 2.4% of the all-time high set on April 29. The company reported earnings after the market close on April 27, beating the consensus estimate of $0.62 per share by 130%.
RCM Technologies’ shares have consistently outperformed the S&P 500 over the past year. Over the four-week period ended April 29, the stock outperformed the index by more than 75 percentage points. Over the last 52 weeks, the stock bested the large-cap index by nearly 392 percentage points. Therefore, it is not surprising that RCM Technologies has an A+ Momentum Grade of A, with a raw score of 100.
RCM Technologies’ shares have risen more than 370% over the last 52 weeks. Over the past four weeks, shares have gained more than 72%.
I have been writing stock screening articles for over 25 years, and each time I add this important disclaimer for those looking at the results of a quantitative screen: The results are the starting point of your analysis, not the finish line.
Screening is beneficial for isolating companies that share common characteristics. But it is still up to you to do additional due diligence before deciding whether any of the companies are suitable for your portfolio.
It is also important to understand the screening filters you are using.
Relative strength is just that—a measure of price performance relative to a benchmark, in this case the S&P 500. In a declining market, a stock with high relative strength may still be falling in price, just at a slower rate than the benchmark.

