In a pivotal moment for the exchange-traded fund (ETF) industry, the Vanguard S&P 500 ETF  (VOO) surpassed State Street’s SPDR S&P 500 ETF Trust (SPY) in assets under management (AUM) in mid-February. As of March 28, the Vanguard S&P 500 commands $587 billion, versus the SPDR S&P 500’s $576 billion.
This changing of the guard marks the end of the SPDR S&P 500’s three-decade reign as the largest ETF tracking the S&P 500 index. But what does this shift mean for individual investors? And, more importantly, which fund deserves a place in your portfolio?
The most important fact for investors to understand is that these two ETFs deliver virtually identical performance by design. Both funds passively track the S&P 500 with near-perfect precision, resulting in performance differences as of February 28, 2025, measured in mere basis points (bps):
This performance parity makes the investor migration to the Vanguard S&P 500 particularly noteworthy since factors beyond basic return figures drive it.
As shown in the table below, the Vanguard S&P 500’s modern structure helps reduce tracking error and enables securities lending—enhancing returns subtly but consistently.
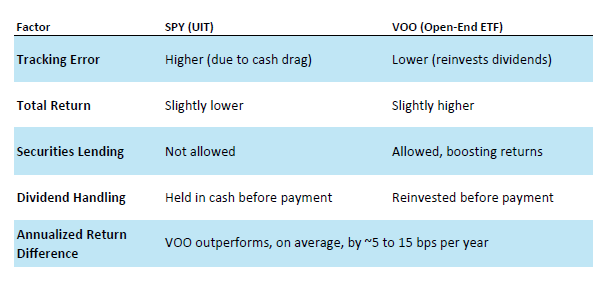
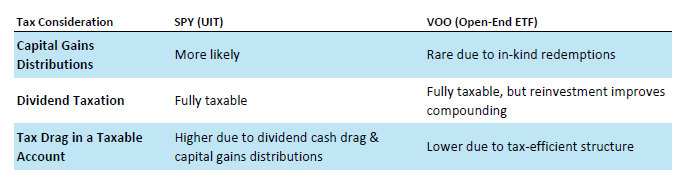
This next table illustrates that the Vanguard S&P 500’s in-kind redemption mechanism helps it avoid the taxable capital gains distributions that often hit the SPDR S&P 500’s investors—especially in years with high turnover or redemptions.
Despite both tracking the S&P 500, the two ETFs operate under fundamentally different legal structures that create meaningful advantages and disadvantages.
The SPDR S&P 500 operates as a unit investment trust (UIT), the oldest ETF structure dating back to its 1993 launch. This structure imposes significant limitations:
The Vanguard S&P 500, launched in 2010, employs a modern open-end fund structure that provides greater flexibility:
The table below summarizes how the Vanguard S&P 500’s flexible legal structure gives it distinct operational advantages that translate into real investor benefits.
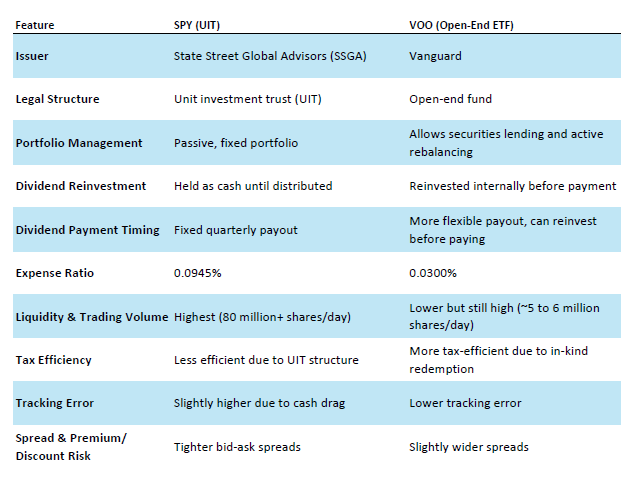
Perhaps the most visible difference between these funds is their expense ratios:
While this 0.0645% difference might seem trivial, it compounds significantly over time. On a $100,000 investment over 30 years (assuming 8% annual returns), the Vanguard S&P 500’s lower expense ratio would generate approximately $19,300 in additional wealth.
Despite the Vanguard S&P 500’s clear cost advantage, the SPDR S&P 500 maintains its dominance in one critical area: liquidity. The SPDR S&P 500 trades approximately 10 times the Vanguard S&P 500’s daily volume, creating several advantages for certain investor types:
This liquidity premium makes the SPDR S&P 500 the preferred vehicle for institutional investors, active traders and those implementing sophisticated hedging strategies.
Rather than declaring one ETF superior, savvy investors recognize that the Vanguard S&P 500 and the SPDR S&P 500 serve different needs:
The SPDR S&P 500 excels for:
The Vanguard S&P 500 shines for:
AAII’s ETF Evaluator provides comprehensive analysis beyond basic cost comparisons for investors seeking deeper insights into these nuanced differences. It’s accessed by typing an ETF’s ticker symbol in the Search box at the top left on AAII.com. This powerful tool reveals:
The ETF Evaluator empowers investors to quantify the subtle differences between these seemingly identical funds and align their selection with specific financial goals and investment time frames.
The AAII ETF Evaluator reveals essential differences between the two leading S&P 500 ETFs. While both track the S&P 500 with remarkably similar performance results, several key distinctions make each fund better suited for different investor profiles.
Both funds deliver nearly identical performance by design, reflecting their shared objective of tracking the S&P 500. Their returns over multiple periods are strikingly similar: one-year return of 18.4% for the Vanguard S&P 500 versus 18.3% for the SPDR S&P 500; three-year return of 12.5% versus 12.4%; and identical five-year returns of 16.8%. Both funds consistently outperform their large blend category average by approximately 1.4 percentage points annually over five years, and both receive consistent A+ Grades of B across most performance time frames, according to the ETF Evaluator.
The most significant distinction lies in their legal structures. The SPDR S&P 500 operates as a UIT established in 1993, while the Vanguard S&P 500 functions as an open-ended investment company launched in 2010. This structural difference extends to their management approaches as well: The SPDR S&P 500 has employed a team management approach since its inception, while the Vanguard S&P 500 has four dedicated managers with an average tenure of 2.6 years.
The Vanguard S&P 500 offers a significant cost advantage, with an expense ratio of just 0.03% compared to the SPDR S&P 500’s 0.09%. While both ratios are far below the category average expense ratio of 0.42%, this difference can significantly impact long-term returns. The Vanguard S&P 500 also maintains a slightly lower portfolio turnover at 2.0% versus the SPDR S&P 500’s 3.0%, further enhancing its cost-efficiency advantage.
The SPDR S&P 500 maintains a substantial edge in trading liquidity, with an average daily volume of approximately 45.9 million shares, compared to the Vanguard S&P 500’s 4.8 million. This liquidity difference makes the SPDR S&P 500 potentially more suitable for active traders, institutional investors and those executing large block trades where minimal market impact is essential.
The ETF Evaluator reveals the Vanguard S&P 500’s slight tax advantage, with a five-year tax-cost ratio of 0.5%, versus the SPDR S&P 500’s tax-cost ratio of 0.6%. This indicates that the Vanguard S&P 500’s structure may provide modest but meaningful tax benefits for investors in taxable accounts through more efficient handling of portfolio gains and dividends.
Despite their structural differences, both funds maintain nearly identical portfolios: The Vanguard S&P 500 holds 508 securities versus the SPDR S&P 500’s 505, with a top 10 holdings concentration of 36.2% for the Vanguard S&P 500 and 34.9% for the SPDR S&P 500. Both allocate 99.3% to domestic stocks and 0.6% to foreign stocks, and they maintain a minimal 0.1% cash position.
From a risk perspective, the funds show minimal differences. The Vanguard S&P 500 has a slightly higher standard deviation at 17.0%, versus the SPDR S&P 500’s 16.9%, but both maintain an identical category risk index of 1.01. Their total risk indexes show minimal variation at 1.14 for the Vanguard S&P 500 and 1.13 for the SPDR S&P 500, with both receiving “average” risk ratings.
These nuanced differences suggest that long-term, buy-and-hold investors may benefit from the Vanguard S&P 500’s lower costs and slightly better tax efficiency. Conversely, active traders, institutions and those implementing complex strategies might prefer the SPDR S&P 500’s superior liquidity despite its marginally higher expense ratio. The ETF Evaluator’s detailed analytics provide the insights to align these subtle distinctions with specific investing goals and trading patterns.
The Vanguard S&P 500’s ascendance signals several significant trends reshaping ETF markets:
For individual investors, this competitive evolution creates more choices and lower costs across the ETF landscape. The SPY-VOO rivalry has spurred significant fee reductions across the industry, with average ETF expense ratios falling dramatically over the past decade.
As ETF providers continue competing on costs, tax efficiency and structural innovations, investors stand to benefit from an increasingly favorable investment landscape.
Whether you value tax efficiency, trading flexibility or long-term cost savings, understanding these structural nuances—supported by tools like the ETF Evaluator—can sharpen your portfolio decisions for years to come.

