For decades, the S&P 500 index has been the cornerstone of passive investing—a one-stop solution offering broad market exposure with minimal fees. It has been championed by investing legends, used as a benchmark by professionals and trusted by millions of individuals building long-term wealth.
But today’s S&P 500 is not your grandfather’s index. The landscape has shifted, and investors may not realize how concentrated and technology-heavy their “diversified” portfolio has become.
As of early 2025, the top 10 companies in the S&P 500 control over 33% of the index’s total weight, and the top five companies alone represent about 25%. The so-called Magnificent Seven technology companies—Apple Inc.  (AAPL), Microsoft Corp. (MSFT), Alphabet Inc. (GOOGL), Amazon.com Inc. (AMZN), Nvidia Corp. (NVDA), Meta Platforms Inc. (META) and Tesla Inc. (TSLA)—dominate headlines and index weightings alike.
This level of concentration is unprecedented in modern market history. In 2010, the top 10 S&P 500 stocks comprised just 19% of the index. Investors buying S&P 500 exchange-traded funds (ETFs) like the SPDR S&P 500 ETF Trust (SPY) or the iShares Core S&P 500 ETF (IVV) are placing one-third of their money into just a handful of companies, most in overlapping technology sectors.
The traditional appeal of index investing is diversification—spreading risk across hundreds of companies. But this safety net becomes weaker when just a few names drive performance. A regulatory crackdown, cybersecurity breach or disruption in artificial intelligence (AI) innovation could simultaneously hit multiple top holdings, dragging down the entire index.
The S&P 500’s heavy tilt toward technology and communication services comes at the expense of other sectors. The industrials, energy, materials and utilities sectors now carry far less weight than before. This makes the index less representative of the entire U.S. economy and more vulnerable to sector-specific volatility.
In recent years, the S&P 500 has posted strong returns, but in many cases, that growth has been concentrated in just a few names. Under the surface, the majority of the index’s 500 companies may be flat or down. Investors relying on headline performance could be misled into thinking the broader market is healthier than it actually is.
One strategy gaining renewed interest is equal-weight indexing. Unlike traditional market-capitalization-weighted funds like the SPDR S&P 500 or the iShares Core S&P 500, equal-weight ETFs such as the Invesco S&P 500 Equal Weight ETF (RSP) give each company the same importance—about 0.2% of the portfolio.
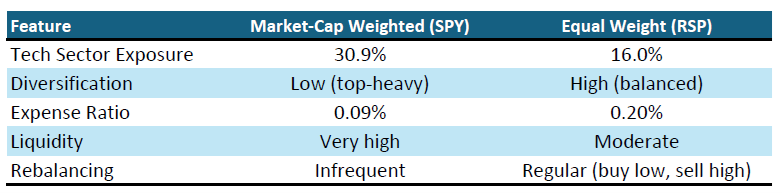
Here’s how sector weightings differ between traditional S&P 500 ETFs—such as the SPDR S&P 500 and the iShares Core S&P 500—and equal-weight funds like the Invesco S&P 500 Equal Weight:
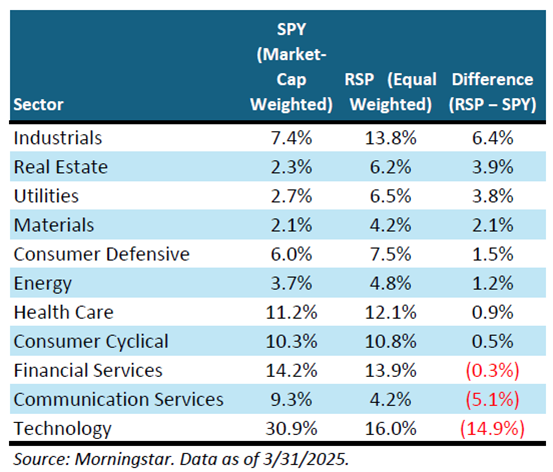
This table underscores how equal-weight strategies significantly reduce overexposure to the technology sector while enhancing exposure to more cyclical or defensive sectors—something traditional cap-weighted funds often neglect.
Over the last decade, the SPDR S&P 500 has outperformed the Invesco S&P 500 Equal Weight thanks to technology’s dominant run, delivering 12.4% annualized returns versus the Invesco S&P 500 Equal Weight’s 9.7% return over the same period through March 31, 2025. However, over the last 20 years, the Invesco S&P 500 Equal Weight has pulled closer, returning 9.6% versus the SPDR S&P 500’s 10.2% return over more extended periods.
During the Great Recession, the technology-heavy S&P 500 plunged 50.1% between October 2007 and February 2009, while the more balanced equal-weighted portfolio lost 53.8%.
The equal-weighted index is prone to outperformance in market cycles favoring value or cyclical sectors.
Equal-weight funds rebalance more often, which can generate higher capital gains in taxable accounts. While ETFs are generally tax-efficient, this is one area where the Invesco S&P 500 Equal Weight may lag the SPDR S&P 500 unless held in tax-advantaged accounts.
The SPDR S&P 500 trades 70 million to 100 million shares daily, making it a favorite for institutional investors and traders. By contrast, the Invesco S&P 500 Equal Weight averages just 7 million shares per day. That lower liquidity can result in wider bid-ask spreads during market stress, an issue for large trades but likely negligible for most long-term investors.
Concerned investors don’t have to choose between the SPDR S&P 500 and the Invesco S&P 500 Equal Weight alone. Other equal-weight or concentration-aware options include:
(GSEW): Lower fees(VXF): Excludes S&P 500 holdings(QQQE): Equal-weights the technology-heavy Nasdaq-100(DLN): Dividend-weighted alternative(MDY): Focuses on mid-caps with more balanced exposureThe table below compares several major ETFs by size, concentration, expenses and performance over three-, five- and 10-year periods. The SPDR S&P 500, also known as SPY, leads in size with $507 billion in assets. It is heavily concentrated, with 33.5% of assets in its top 10 holdings. The SPDR S&P 500 has an expense ratio of 0.09%. Over the past three years, the SPDR S&P 500 posted a return of 9.0%, with an A+ Investor Grade of B compared to other funds in the equity large blend category. Its five-year return was 18.5%, also a grade of B. Over 10 years, it earned a return of 12.4% for a grade of B.
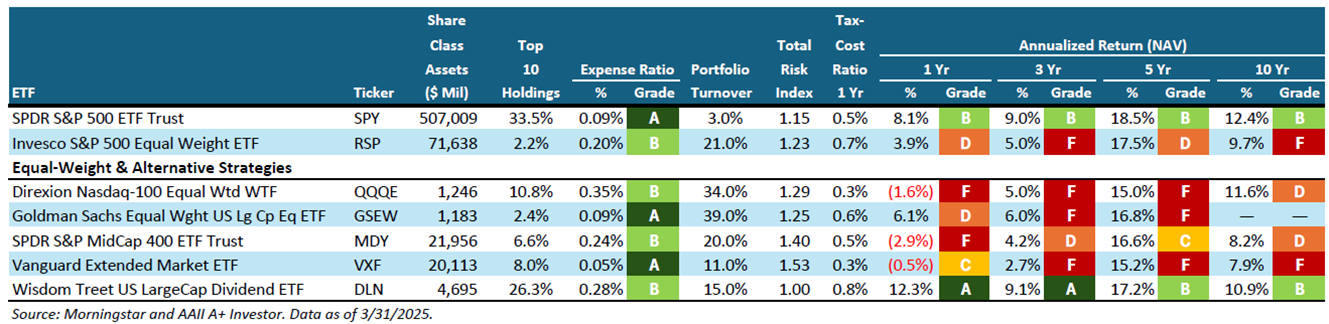
The Invesco S&P 500 Equal Weight, or RSP, holds $71.6 billion in assets and spreads its investments evenly across the S&P 500, with only 2.2% concentration in its top 10 holdings. The Invesco S&P 500 Equal Weight’s expense ratio is 0.20%. The fund returned 5.0% over three years, which is a grade of F compared to all other large blend funds. Its five-year return was 17.5%, a grade of D, and its 10-year return was 9.7%, also a grade of F.
The Goldman Sachs Equal Weight U.S. Large Cap Equity, or GSEW, returned 6.0% over three years for a grade of F among its peers. Its five-year return was 16.8% for a grade of F.
The Vanguard Extended Market, or VXF, focuses on mid- and small-cap stocks. It posted a three-year return of 2.7%, a five-year return of 15.2% and a 10-year return of 7.9%, all of which had grades of F compared to other ETFs in the mid-cap blend category.
The Direxion Nasdaq-100 Equal Weighted, or QQQE, is in the large-growth category. It returned 5.0% over three years, which is a grade of F compared to its peers. Its five-year return was 15.0%, also with a grade of F, and its 10-year return was 11.6% with a grade of D.
The results highlight that cap-weighted funds like the SPDR S&P 500 have performed better over the past decade, while equal-weighted and alternative strategies have lagged during a period of concentrated market leadership among large technology companies.
For more detailed information on these or any other ETFs in the AAII database, enter the ticker into the search bar at the top-left corner of every AAII.com page to view the ETF Evaluator. These pages contain data from Morningstar and are updated monthly, usually by the fifth business day of the month.
The S&P 500 remains a powerful tool for building wealth—but it’s not the one-size-fits-all solution it once was. With mega-caps now dominating performance, investors must look under the hood and consider whether their portfolios are truly diversified.
In a world where “diversified” can mean 30% exposure to 10 companies, it’s time for a deeper conversation about what diversification really means. The solution isn’t to abandon index investing but to evolve alongside it.

