Key Takeaways:
Some of the market’s most significant moves don’t start with headlines. They begin with expectations quietly shifting beneath the surface. When analysts revise their earnings forecasts for a stock, they’re revealing something powerful: a change in how the market views a company’s future. These revisions—especially when paired with earnings surprises—can create early signals that often precede meaningful stock price gains.
In this installment of Making the Grade, we show you how to use the A+ Stock Grades Screener to identify companies with substantial upward estimate revisions—stocks the market may be repricing before most investors notice. We also explore how combining estimate revisions with factors like value and quality increases your edge and how AAII’s portfolio and alert tools help you stay one step ahead.
If you’re ready to move beyond reactive investing and toward signal-driven decision-making, this guide will show you how to use estimate revisions as a strategic advantage.
When companies report earnings that surprise to the upside—or disappoint—markets take notice. But the impact isn’t fleeting. Earnings surprises, especially negative ones, can shape stock performance for months, often persisting long after the headline fades. Positive surprises tend to fuel outperformance, while negative ones frequently trigger extended underperformance. For large-cap firms with broad analyst coverage, these reactions unfold swiftly.
Yet it’s not just the reported numbers that move markets—expectations matter just as much. The market reacts when analysts revise earnings estimates, especially in significant ways. Stocks with upward estimate revisions of 5% or more frequently outperform, while those with downward revisions often struggle. When individual analyst forecasts diverge from the consensus, those outlier revisions can signal shifting sentiment before the broader market catches on.
As of mid-May 2025, the first-quarter earnings season for the S&P 500 index has delivered broadly strong results, with both the frequency and magnitude of positive earnings surprises coming in above long-term averages. According to FactSet, 90% of S&P 500 companies had reported earnings by May 9. Of these, 78% exceeded consensus earnings estimates—above the five-year average of 77% and the 10-year average of 75%—while aggregate earnings came in 8.5% above estimates, slightly below the five-year average of 8.8% but above the 10-year average of 6.9%
Notably, the market reaction to these surprises was more favorable than usual. Companies that beat earnings expectations saw their stock prices increase by an average of 1.9% in the four-day window around the announcement. This is the highest average gain for positive earnings surprises since third-quarter 2022 and significantly above the five-year average of 1.0%. Meanwhile, firms that missed expectations experienced a smaller-than-average stock price decline of 1.7%, compared to a five-year average drop of 2.3%.
Sector-wise, communication services, financials and health care were key drivers of earnings growth. The overall blended year-over-year earnings growth rate for first-quarter 2025 reached 13.4% as of May 9, up from 12.8% in the previous week and markedly higher than the 7.1% reported at the end of the first quarter. If this rate holds, it would represent the second consecutive quarter of double-digit earnings growth and the seventh straight quarter of year-over-year improvement.
Revenue performance, however, was more subdued. Only 62% of S&P 500 companies beat revenue estimates—below the five-year average of 69%—with aggregate revenues coming in just 0.7% above expectations. The blended revenue growth rate stood at 4.8%.
Looking ahead to second-quarter 2025, the earnings outlook is becoming more cautious. Analysts cut second-quarter earnings estimates by 2.4% during April, dropping the bottom-up estimate from $65.55 to $63.96 per share. This downward revision is steeper than historical norms: the five-, 10-, 15- and 20-year averages for estimate cuts in the first month of a quarter range between 1.6% and 1.9%. The energy (–14.8%) and industrials (–4.1%) sectors had the largest cuts, while utilities (+0.8%) and information technology (+0.2%) were among the few sectors with upward revisions.
Despite these revisions, companies are essentially maintaining their full-year 2025 guidance. Among the 478 S&P 500 firms that had reported by May 22, only eight (3%) withdrew or declined to update full-year 2025 earnings guidance, primarily citing tariff-related uncertainty. In contrast, 251 companies reaffirmed or updated their guidance: 64 raised it, 139 maintained previous outlooks and 37 lowered it.
Executives also signaled growing macroeconomic caution. “Uncertainty” was cited in 84% of first-quarter 2025 earnings calls—381 companies in total—marking the second-highest level in 10 years and the most since first-quarter 2020. Additionally, 121 companies cited “recession,” up from just 13 in the prior quarter. This is the highest recession-related commentary since fourth-quarter 2022.
These signals suggest that while corporate earnings have been resilient, analyst and executive sentiment remains cautious—driven by tariff developments, global economic risks and signs of decelerating momentum in forward-looking estimates.
Among the 6,704 U.S.-listed stocks in AAII’s database, 3,768 had at least one analyst estimate for their current fiscal quarter or year as of May 23, 2025. Of the 3,402 that reported earnings since the beginning of April:
A+ Investor subscribers have exclusive access to A+ Stock Grades for more than 6,700 stocks for value, growth, momentum, quality and earnings estimate revisions. The Earnings Estimate Revisions Grade ranks companies by the statistical strength of their two latest quarterly earnings surprises and earnings revisions for the current fiscal year over the last month and last three months.
Earnings estimates are a crucial element to consider when investors seek stock ideas and manage their holdings.
Using the A+ Stock Grades Screener, you can isolate those companies that grade highly based on earnings estimate revisions (along with growth, value, momentum and quality).
As we near the end of the earnings reporting season, let’s identify companies that have reported strong earnings surprises, as well as those seeing their consensus estimates revised upward.
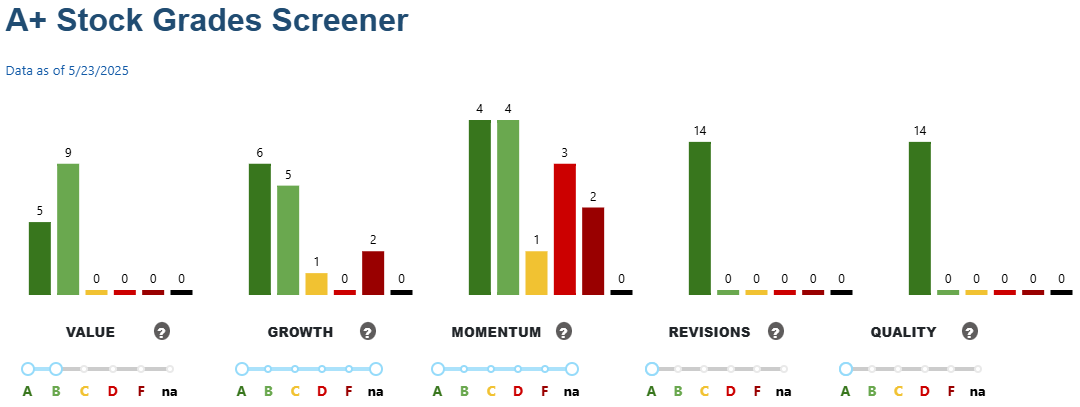
The A+ Stock Grades Screener allows you to filter for stocks with specific factor grades. As of the close on Friday, May 23, 2025, of the 6,694 companies in the stock universe, 3,805 (56.8%) have an Earnings Estimate Revisions Grade. Of those, 298 (4.5% of the total universe and 7.8% of the Earnings Estimate Revisions Grade universe) have an Earnings Estimate Revisions Grade of A.
However, this is still a large universe of companies to sift through. To narrow the universe even further, a filter of Quality Grade of A was applied. Currently, 1,252 companies in the A+ Investor universe have a Quality Grade of A, while 49 have grades of A for both earnings estimate revisions and quality.
Research from David Dreman and others shows that deep-value companies respond more favorably to significant positive earnings surprises and react less adversely to negative ones. Therefore, the next filter applied looked for a Value Grade of B or better. There were 1,939 companies with a Value Grade of A or B, and adding this filter to the others reduced the number of passing companies to 14.
The passing companies are ranked by Earnings Estimate Revisions Score, from highest to lowest. The screenshot below shows the first 10 stocks.
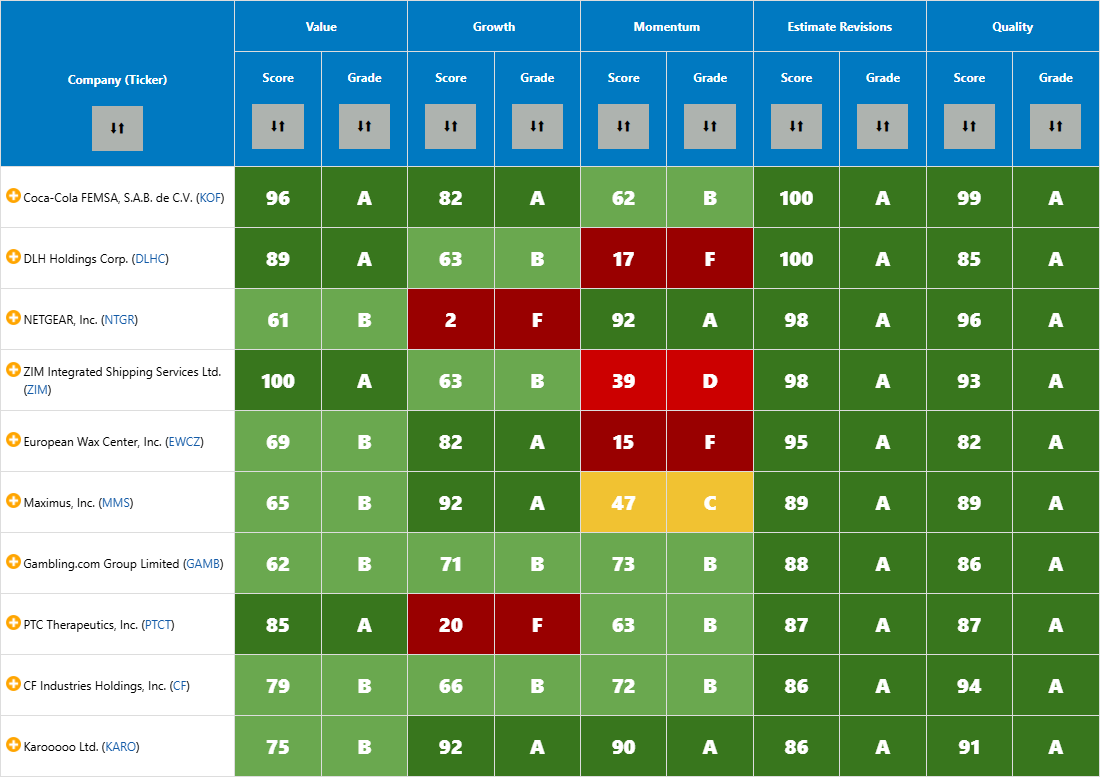
Coca-Cola FEMSA  (KOF) and DLH Holdings Corp. (DLHC) have the highest Earnings Estimate Revisions Score of 100. NetGear Inc. (NTGR) and ZIM Integrated Shipping Services Ltd. (ZIM) had the second-highest Earnings Estimate Revisions Score among the final companies at 98.
1. Access the A+ Stock Grades Screener
Log in to AAII.com and navigate to the Stock Grades area from the Stocks drop-down menu at the top of the home page.
2. Apply Your First Filter
Under Revisions, move the right slider button to the left to “A.” The Revisions histogram will only show a dark green bar to signify that only stocks with grades of A have been selected. As of May 23, this identified 298 stocks.
3. Add Quality Filter
Under Quality, move the right slider button to the left to “A.” The Quality histogram will only show a dark green bar to signify that only stocks with grades of A have been selected. As of May 23, this identified a total of 49 stocks.
4. Add Value Filter
Apply “Value Grade = A or B” filter. Under Value, move the right slider button to the left to “B.” The Quality histogram will show a dark green bar and light green bar to signify that only stocks with grades of A or B have been selected. This reduced the list to 14 stocks.
Clicking the Up/Down arrows under Score and Grade for the five A+ Stock Grades will sort the passing company table in either ascending or descending order.
(KARO)Clicking on the ticker for Karooooo, which is rated highly across all five stock grades, takes us to its Stock Evaluator page. From there, clicking the Grades tab gives us a detailed explanation of the five individual factor grades. For this example, we focus on Karooooo’s Earnings Estimate Revisions Grade.
Karooooo is a Singapore-headquartered global mobility software-as-a-service provider operating through its Cartrack and Karooooo Logistics platforms. The company specializes in fleet management, asset tracking, driver behavior monitoring and optimizing last-mile delivery. Its solutions encompass real-time GPS tracking, predictive maintenance, fuel monitoring, geofencing and safety analytics powered by artificial intelligence (AI). As of fiscal-year 2025, Karooooo serves over 2.3 million subscribers across 23 countries, with a strong presence in South Africa, Europe and Southeast Asia.
The name “Karooooo” originated from a domain name mishap during the company’s rebranding process. When Cartrack Holdings, founded in South Africa in 2001, decided to rebrand and expand globally, they aimed to adopt the name “Karoo.” However, the desired domain name was already taken. To secure an available domain, they added extra “o”s, resulting in “Karooooo.” This unique name has since become a distinctive brand identity for the company.
As of May 23, Karooooo had an Earnings Estimate Revisions Score of 86, translating to a grade of A.
This grade is arrived at by using four different pieces of data:
A company’s Earnings Estimate Revisions Grade is based on one to four of these elements. A company must have valid, non-null values for at least one of these elements to receive a grade.
To say that a company missed or exceeded its quarterly consensus earnings estimate does not necessarily capture the real significance of such an event. An earnings surprise is considered more significant the farther it is outside the statistical range of estimates expected at the time of the announcement. Assuming a normal distribution of earnings estimates, 68.2% of actual earnings will be within one standard deviation of the consensus estimate, 95.4% within two standard deviations and 99.7% within three standard deviations. The absolute value of the SUE score measures the degree of unexpected earnings. There is no earnings surprise when the SUE score equals zero; the actual earnings per share are in line with the consensus earnings estimate.
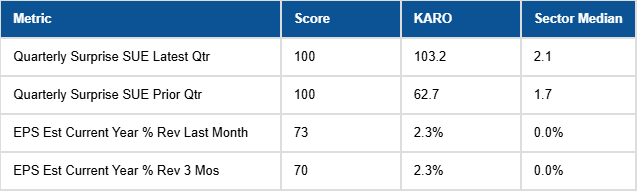
Karoooo reported positive earnings surprises of 37.5% and 13.9%, respectively, for its last two fiscal quarters. The two analysts tracking Karooooo are closely aligned, meaning there is little standard deviation for its estimates. This, coupled with the significant earnings surprises, led to SUE scores of 103.2 and 62.7, respectively, for its last two quarters. These rank in the top percentile among all U.S.-listed stocks.
Since announcing its latest results on May 14, Karooooo’s upward earnings revisions for its current fiscal year ending February 28, 2026, have been relatively muted:
These revision percentages ranked in the 73rd and 70th percentiles, respectively.
If you wish to monitor the stocks that pass the filters you create using the A+ Stock Grades Screener, you can do so by creating a “watchlist” with My Portfolio. A watchlist is a list of securities that are being monitored for potential trading or investing opportunities.
Looking back at the screenshot depicting the top 10 companies passing our estimate revisions filters, we see that each ticker on the table has a yellow “+” next to it. These plus signs also appear throughout the AAII website. They allow you to add these securities to a new or existing watchlist or portfolio.
Once you have created a watchlist of stocks, you can go to My Portfolio, load that watchlist portfolio and view a variety of data on those tickers.
A+ Investor and Platinum subscribers can also set up alerts for price activity and changes to A+ Stock Grades.
The Grade Alerts tool allows A+ Investor and Platinum subscribers to track daily grade changes for stocks that you follow in portfolios you created with My Portfolio. These grades are only for stocks in the A+ Investor stock universe. There are no grade alerts for mutual funds or exchange-traded funds (ETFs).
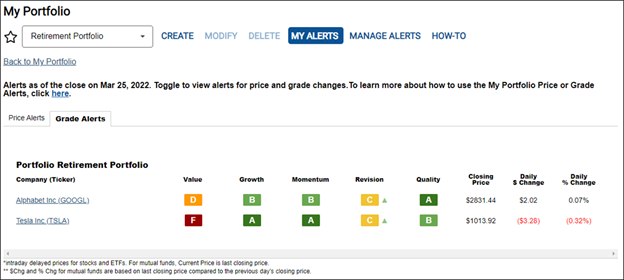
The Grade Alerts are triggered if stocks in the portfolio(s) you specify meet the grade-change criteria you set up. These alerts are posted online at the My Portfolio area of the AAII website by going to the My Alerts section and selecting the Grade Alerts tab. My Portfolio grade changes are updated after the end of each trading day.
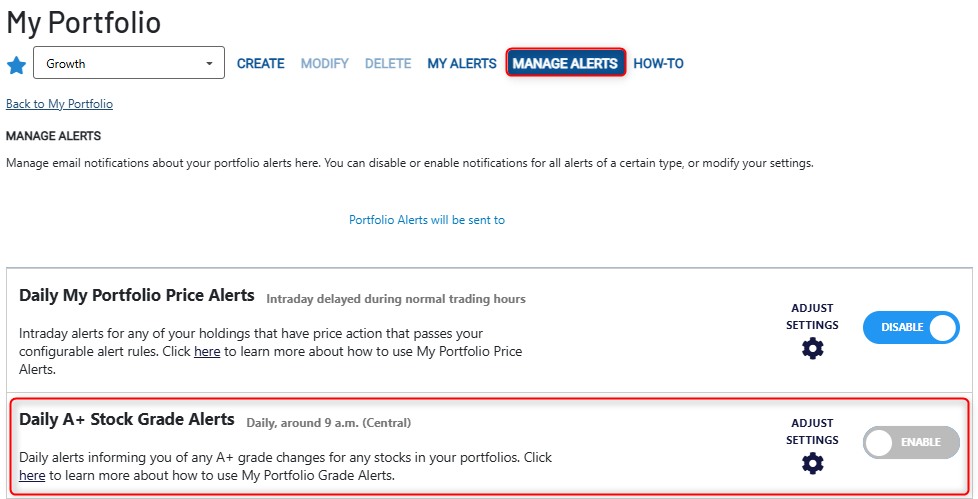
The Manage Alerts tab is where AAII members can go to manage notifications about their portfolios.
You can disable or enable notifications for all alerts (Price and A+ Stock Grade) of a certain type or modify your settings. First, you need to enable the alerts. You do this by clicking the Enable toggle for the Daily A+ Stock Grade Alerts. Then you need to click Adjust Settings to manage your grade alert rules.
After clicking Adjust Settings, you can select the grade changes you’d like to receive alerts on. The screenshot below shows the options you have to choose from.
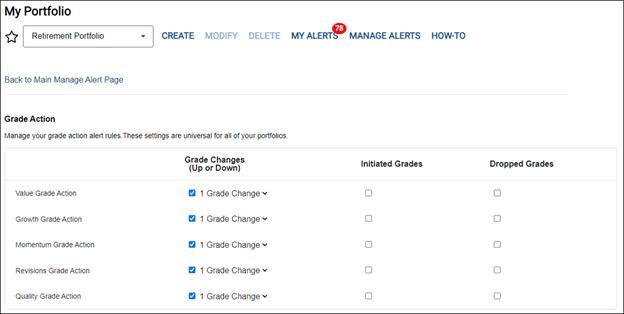
A+ Investor and Platinum subscribers can choose to receive grade alerts for all of the portfolios set up in My Portfolio or for select portfolios. The grade action settings are universal for all of the portfolios you select. A universal setting means that alerts are set for all of the holdings in a particular portfolio and cannot be set for individual holdings at this time.
Subscribers can define custom grade alert settings for stocks added to My Portfolio. Users can define grade changes (up or down) for the five investment factors (value, growth, momentum, earnings estimate revisions and quality). For each of these five investment factors, A+ Investor subscribers can select to view grade changes (up or down) for one grade change, two grade changes, three grade changes and four grade changes.
A+ Investor subscribers can also choose to view stocks with newly initiated grades by checking the box under Initiated Grades for each factor. For example, some stocks may not presently have a grade for a certain factor because they don’t meet the minimum number of valid (non-null) ratios and corresponding ranking to be assigned a grade. When they do meet the criteria for generating a grade, you can be notified.
A+ Investor subscribers can also choose to view stocks with newly dropped grades by checking the box under Dropped Grades. Similar to newly initiated grades, some stocks had a grade assigned for a certain factor because they met the minimum number of valid (non-null) ratios and corresponding ranking required to receive a grade; however, they no longer do.
With the desired grade alert settings selected, you can view a summary of your stocks that meet your grade alert settings by clicking on My Alerts at the top of the page then choosing the Grade Alerts tab. The up or down arrow next to the grade letter shows you the direction of the change in grade. Only those stocks that have met your specified alert criteria will appear on the Grade Alerts tab.
Earnings estimate revisions are more than just analyst noise—they’re one of the market’s most reliable early indicators of shifting sentiment and momentum. By combining these revisions with consistent surprises and high-quality fundamentals, you position yourself to uncover companies with a strong likelihood of outperforming.
With the A+ Stock Grades Screener, AAII members have a professional-grade tool to isolate stocks that meet rigorous, data-driven criteria. Whether you’re building a new watchlist, refining your portfolio or looking to act on recent earnings trends, the screener puts real-time insights directly in your hands.
Most importantly, by integrating estimate revisions with other factors—value, quality, growth and momentum—you create a multidimensional lens that goes far beyond traditional stock screens.
If you haven’t already, take the next step: Apply these filters, build your watchlist, set your alerts and start putting institutional-grade signals to work. Your edge in today’s market begins with better data—and a smarter way to act on it.

