 FZROX
NOSIX
OEICX
OGEAX
PSIAX
PSICX
RYSYX
SCHB
SCHX
SWTSX
SXPAX
SXPCX
VFIAX
VOO
VTI
VTSAX
FZROX
NOSIX
OEICX
OGEAX
PSIAX
PSICX
RYSYX
SCHB
SCHX
SWTSX
SXPAX
SXPCX
VFIAX
VOO
VTI
VTSAX
The promise of index fund investing appears straightforward: Own a slice of the S&P 500 index at low cost and earn market returns. However, our analysis of 28 “pure” S&P 500 index mutual funds—all tracking the identical S&P 500 Total Return index—reveals a more complex reality where fund selection dramatically impacts investor wealth. While this analysis focuses on mutual funds, investors should note that exchange-traded funds (ETFs) typically offer even lower costs and greater trading flexibility for similar index exposure.
Our analysis examines 28 funds from 20 different fund families, all tracking the same S&P 500 index, yet delivering five-year returns ranging from 13.2% to 15.9%—a 2.7 percentage point annual spread that compounds to significant wealth differences over time.
The cost-performance relationship: The Vanguard 500 Index Admiral fund (VFIAX) charges 0.04% in fees and delivered a 15.9% average annual five-year return, with $528.5 billion in assets. The Rydex S&P 500 C fund (RYSYX) charges 2.38% annually and achieved a 13.2% average annual five-year return, managing $11 million in assets. This 2.7 percentage point annual performance gap results in a wealth difference of approximately $363,000 over 20 years on a $50,000 investment.
The fee impact compounds: The 2.34% expense ratio difference means investors in the Rydex S&P 500 C pay an extra $1,170 annually in fees on a $50,000 investment—money that, if invested at market returns, would grow to approximately $155,000 in wealth over 20 years. The performance gap combined with fee differences significantly impacts long-term wealth accumulation.
The pattern repeats across cost tiers: Even among moderately expensive options, costs matter. The DWS S&P 500 Index C fund (SXPCX), which has a 1.26% expense ratio, delivered 14.5% on average over five years, while the Northern Stock Index fund (NOSIX), which has a 0.05% expense ratio, returned 15.8%. Both funds track identical indexes, yet the five-year return of the lower-cost fund was 1.3 percentage points higher.
The extreme cost differences highlighted in our analysis often stem from share class engineering. The expensive Rydex S&P 500 C represents Class C shares, which carry a 1% annual 12b-1 fee in addition to management costs, totaling 2.38% in annual expenses. These shares appear attractive because they avoid upfront sales charges, but the fund imposes ongoing charges that continue indefinitely.
Share class variations within fund families demonstrate cost impact: Even within the same fund company, share class selection significantly affects returns:
DWS S&P 500 Index variations:
(SXPAX): 0.54% expense ratio, 15.3% five-year return(SXPCX): 1.26% expense ratio, 14.5% five-year returnPGIM Quant Solutions variations:
(PSIAX): 0.52% expense ratio, 15.3% five-year return(PSICX): 1.26% expense ratio, 14.5% five-year returnThe pattern is consistent: Higher fees correlate with lower net returns to investors, even within identical investing strategies from the same management team.
These ongoing charges make Class C shares particularly expensive for buy-and-hold investors. While they may be appropriate for investors with short-term holding periods (typically under three years), long-term investors benefit from other types of shares.
For example, the JPMorgan Equity Index fund is offered in multiple share classes:
The Select shares save investors 0.68 of a percentage point annually—$340 per year on a $50,000 investment.
The Investment Company Institute reported that average expense ratios for equity mutual funds have declined for 15 consecutive years, falling to 0.40% in 2024—a 62% reduction since 1996. This compression reflects both increased competition and investor migration toward lower-cost options, with 92% of long-term mutual fund gross sales in 2024 going to no-load funds without 12b-1 fees.
Operational insights from this universe:
This pattern highlights that index fund management is primarily operational—the focus is on minimizing costs and tracking error rather than stock selection, making high fees difficult to justify.
The Vanguard 500 Index Admiral demonstrates that quality index management can be delivered at a low cost while maintaining performance.
The data below shows that fund families with strong institutional relationships and larger scale typically deliver lower costs to investors, while those dependent on retail distribution networks charge higher fees.
Beyond expense ratios, mutual funds generate revenue through securities lending programs, where portfolio holdings are temporarily loaned to institutional borrowers for fees. This additional income can meaningfully offset fund expenses.
According to a recent EquiLend Data & Analytics press release, the global securities finance industry generated $955 million in May 2025, up 7% year over year. Large index fund sponsors like Vanguard, Fidelity and Charles Schwab have consistently generated securities lending returns that effectively reduce net investor costs.
However, revenue-sharing arrangements vary significantly. Some fund companies share 80% to 100% of securities lending income with shareholders, while others retain substantial portions. Vanguard, for example, returns 100% of net securities lending revenue to shareholders, while other companies may keep 20% to 50%.
This difference, while not reflected in stated expense ratios, affects net investor returns and helps explain why some funds with identical expense ratios may deliver slightly different performance.
Even funds with identical expense ratios can deliver different returns due to tracking error—the standard deviation of return differences between a fund and its benchmark index. Our analysis of current index funds shows tracking errors ranging from 0.01% to over 0.25% annually.
Factors contributing to tracking differences in mutual funds include the following.
Quality S&P 500 index mutual funds typically maintain tracking errors below 0.15% annually. Funds consistently exceeding this threshold may indicate operational inefficiencies or poor fund management.
The Mutual Fund Screener available to A+ Investor subscribers provides an efficient method for evaluating index fund options. To replicate our analysis, follow these steps.
1. Click on Create a New Screen under Mutual Fund Screener Home on the left-hand navigation bar, and then click Add Filters at the middle of the screen
2. Within the Select Your Screening Filters window, select the following:
3. Click the Apply button in the bottom-right corner of the Select Your Screening Filters window. This will return you to the Mutual Fund Screener, where you specify the requirements for the chosen filters.
4. These filters narrow down the universe to 43 funds. Click on Find Funds at the upper-right portion of the screen.
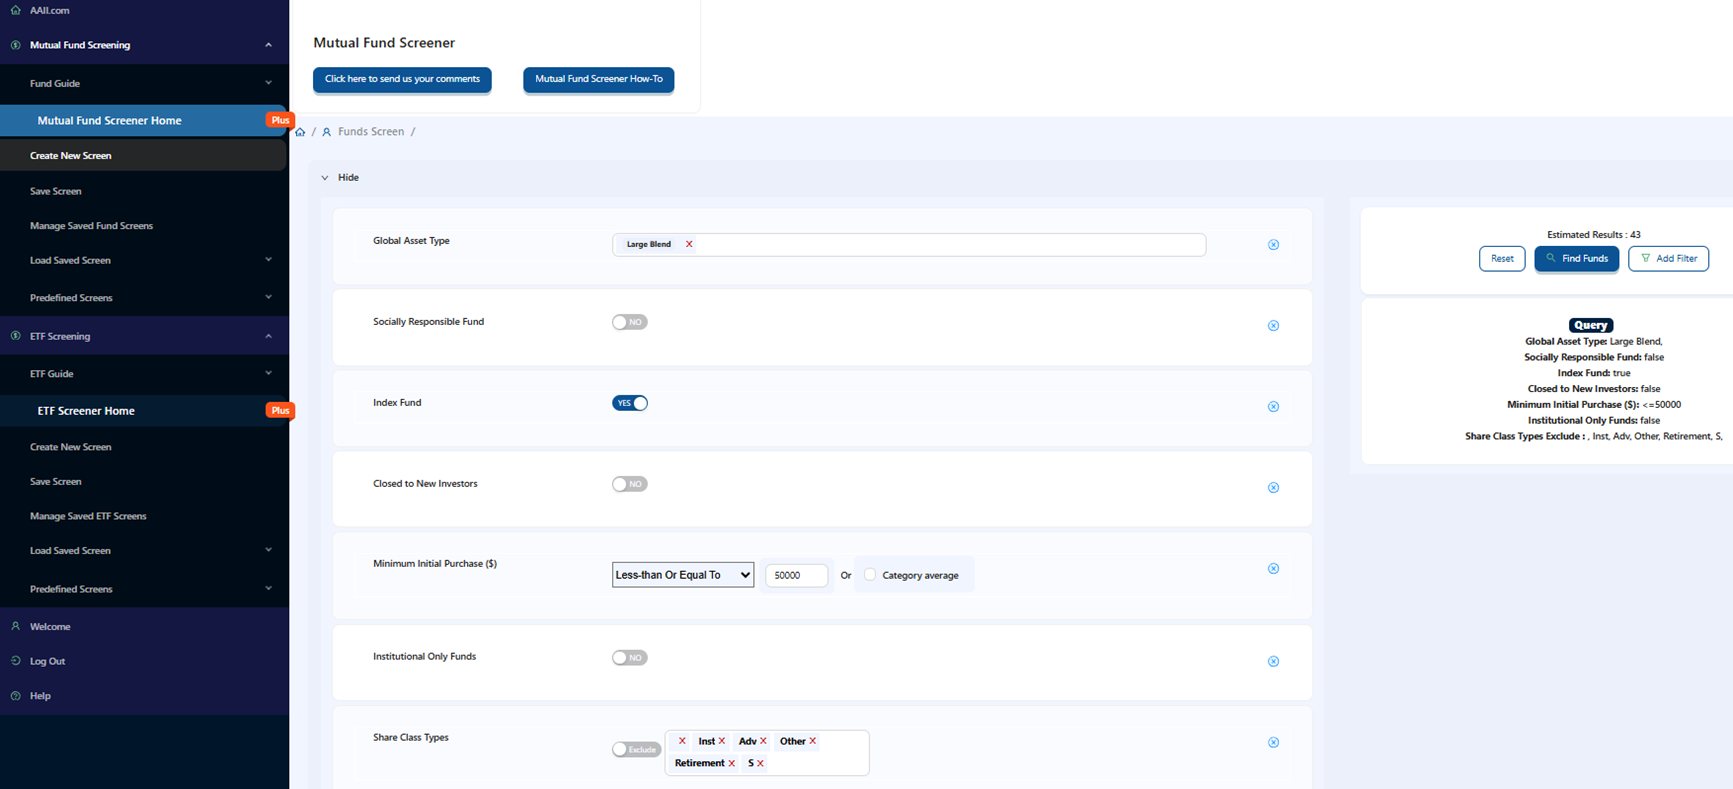
Below the filtering criteria, you will find the list of passing funds. This table has multiple tabs breaking down the information and data for each fund. The Management & Fees tab reveals critical details about share class structures, including front-end loads, back-end loads and 12b-1 fees that significantly impact total investor costs.
You can export the list of passing funds to Excel by clicking on the green Export to Excel button at the top-right of the passing funds table and again selecting the Export to Excel button from the pop-up in the middle of the screen.
We sorted this spreadsheet to perform additional filtering:
1. Removed funds with a Number of Holdings less than 480 and more than 520 (column BO in the spreadsheet)
2. Removed funds that don’t track the S&P 500 TR USD index (column CA)
While our analysis focuses on S&P 500 funds, investors should consider whether broader market exposure better serves their objectives. The S&P 500 represents approximately 80% of total U.S. market capitalization, but total stock market index funds include mid-cap and small-cap securities that have historically provided different risk-return characteristics.
Current S&P 500 concentration presents additional considerations. The information technology sector comprises nearly 30% of the index, with the top four sectors representing 66.1% of the total index weight. This concentration contributed to the S&P 500’s 4.6% decline in the first quarter of 2025 when technology stocks fell sharply.
Leading total market index mutual funds offer comparable costs while providing broader diversification.
(FZROX): 0% expense ratio, $26.2 billion in assets, no minimum investment(VTSAX): 0.04% expense ratio, $1.74 trillion in assets, $3,000 minimum investment(SWTSX): 0.03% expense ratio, $27.3 billion in assets, no minimum investmentAsset size and investor preferences: The concentration of assets in low-fee funds, exemplified in the Vanguard 500 Index Admiral’s $528 billion in assets, indicates market demand for low-cost indexing. These funds demonstrate that quality index management can be delivered at low cost while maintaining operational standards.
While our analysis focuses specifically on mutual funds, investors should strongly consider ETF alternatives, as they often provide identical S&P 500 exposure at even lower expense ratios with additional benefits.
S&P 500 ETF alternatives:
(VOO): 0.03% expense ratio vs. 0.04% for the mutual fund version(SPLG): 0.02% expense ratio(SCHX): 0.03% expense ratioTotal Market ETF alternatives:
(VTI): 0.03% expense ratio vs. 0.04% for the Vanguard Total Stock Market Index Admiral(SCHB): 0.03% expense ratioETFs also offer potential tax advantages through intraday trading flexibility, no investment minimums and in-kind redemption mechanisms that can eliminate most capital gains distributions. However, they require brokerage accounts and trade like stocks, which may not suit all investors’ preferences for automatic investing or fractional shares. For many investors, particularly those seeking the absolute lowest costs and maximum flexibility, ETFs represent a compelling alternative to the mutual funds analyzed in this report.
For 401(k) and 403(b) participants: Focus on the lowest-cost broad market index fund available within your plan’s fund lineup. Many employer plans now offer institutional share classes of major index funds with expense ratios below 0.05%. If no quality index options exist, consider contributing enough to capture any employer match, then directing additional retirement savings to an individual retirement account (IRA) with superior fund choices.
For IRA investors: You have access to the full universe of mutual funds. Prioritize established providers offering expense ratios below 0.05% for broad market exposure. Consider admiral or institutional share classes if you meet minimum requirements.
For taxable account investors: Index mutual funds work well for automatic investing and dividend reinvestment. However, consider ETF alternatives if seeking maximum tax-efficiency or if your investment amounts don’t meet mutual fund minimums.
Based on current market conditions, consider these screening criteria for index mutual funds:
Based on our data analysis, try to avoid these patterns:
While the index mutual fund industry has improved significantly, with quality low-cost options widely available, expensive alternatives persist. Class C shares and specialty service class funds continue to charge 1% to 2%+ annually for market exposure available elsewhere for as low as 0.04%. The mathematics of compounding work against investors paying higher fees—a one-percentage-point difference in annual expense can reduce terminal wealth by approximately 26% over 30-year periods.
Competition among mutual fund providers has created a favorable environment for index fund investors. Low-fee mutual funds, widespread availability of sub-0.10% expense ratios and improved operational efficiency have addressed many historical concerns about mutual fund selection.
However, the disparity between lower- and higher-cost options remains substantial within the mutual fund universe. While ETFs often provide even lower-cost alternatives, mutual funds continue to play an important role for investors who value automatic investing, fractional shares and simplified retirement plan integration. Investors who approach mutual fund selection systematically—focusing on costs, tracking efficiency and operational quality—can benefit from index fund investing while avoiding the higher-cost alternatives.
The key finding from our analysis remains consistent: Investors should carefully consider fees when selecting mutual funds. In a market with numerous low-cost choices, there is little reason to accept expensive alternatives for identical market exposure.
For AAII members, the tools and analysis framework we provide can help identify quality, low-cost index mutual funds. The primary consideration is avoiding expensive alternatives that continue to exist in certain distribution channels.

