The gap between what your fund owns and what you pay can significantly impact returns. Most investors check their fund returns without realizing they’re seeing two different numbers: the net asset value (NAV) return, which reflects the actual performance of underlying securities, and the price return, which shows what investors actually pay in the market. This distinction matters more than ever as market volatility increases and U.S. Securities and Exchange Commission (SEC) regulations reshape fund reporting requirements.
Understanding this difference isn’t just an academic exercise. During the August 2015 flash crash, investors with trailing stop-loss orders on blue-chip ETFs incurred significant losses when temporary pricing dislocations triggered sales at prices far below the actual asset values. Meanwhile, savvy investors who understood NAV mechanics capitalized on these brief arbitrage opportunities. The knowledge gap between these two groups resulted in millions of unnecessary losses.
NAV represents the per-share value of a fund’s underlying holdings, calculated by dividing the difference of total assets minus liabilities by shares outstanding. For mutual funds, this calculation occurs once daily after the market closes at 4:00 p.m. Eastern Time, resulting in a single price at which all trades are executed. ETFs, however, trade continuously throughout the day like stocks, with market prices fluctuating based on supply and demand, while the indicative NAV is updated every 15 seconds.
The price return reflects what investors actually experience when buying or selling shares of a fund. For mutual funds, the price and NAV are identical, as all transactions occur at the daily NAV. ETFs can trade at premiums (above their NAV) or discounts (below their NAV), creating opportunities and risks. According to Morningstar’s analysis of 536 ETFs over the 10 years ended in 2019, 86% of funds traded within a premium or discount range of just 0.05% of their NAV, but specific circumstances can create wider gaps.
This difference matters because it affects your actual returns. If you buy an ETF at a 1% premium and sell it at the NAV, you’ve lost that 1% regardless of how the underlying securities performed. Conversely, buying at a discount and selling at a premium adds to your returns beyond what the fund’s holdings delivered.
Authorized participants—specialized financial institutions that can create or redeem large blocks of ETF shares—typically maintain prices in alignment through arbitrage. When an ETF trades at a premium, these firms buy underlying securities, exchange them for new ETF shares and sell those shares for profit. This mechanism works remarkably well for domestic equity ETFs, such as the SPDR S&P 500 ETF Trust  (SPY) or the Vanguard Total Stock Market Index Fund ETF (VTI), which typically trade within one to three basis points (bps) of their NAV. International and bond ETFs face larger discrepancies due to time zone differences, liquidity variations and higher transaction costs.
The creation and redemption process happens in large blocks, typically 50,000 shares or more. This means average retail investors can’t directly arbitrage pricing differences, but the mechanism still protects them from extreme dislocations. When premiums or discounts persist, it usually signals underlying market stress or structural issues with the fund’s holdings.
The 2024–2025 period demonstrated how various market conditions affect NAV-price relationships. When bitcoin ETFs launched in January 2024, the different NAV calculation methodologies employed by providers created confusing premium and discount patterns. The iShares Bitcoin Trust ETF (IBIT) employs volume-weighted average pricing between 3:00 p.m. and 4:00 p.m. Eastern Time In contrast, its competitors utilize different windows, resulting in apparent pricing discrepancies that do not accurately reflect true arbitrage opportunities.
International ETFs consistently show the widest premiums and discounts due to non-overlapping trading hours. The iShares MSCI Emerging Markets ETF (EEM) serves as a price discovery mechanism for Asian markets during U.S. trading hours, with its price reflecting investor sentiment about overnight developments before the underlying markets open. Academic research from 2024 to 2025 confirms that international ETFs effectively predict next-day NAV movements, making premiums and discounts informational rather than problematic.
Bond ETFs present unique challenges since underlying bonds trade infrequently. During the Great Recession, the iShares iBoxx Investment Grade Corporate Bond ETF (LQD) maintained a persistent 2.3% premium for months as it became more liquid than the underlying bonds. The SEC’s August 2024 monthly reporting requirements aimed to improve transparency in these markets.
Small-cap and sector-specific funds face liquidity-driven discrepancies. When market makers struggle to hedge positions efficiently, bid-ask spreads widen and premiums or discounts can persist. The iShares Russell 2000 ETF (IWM) occasionally trades at meaningful discounts during volatile periods, when creation and redemption costs are high.
The SEC’s October 2022 tailored shareholder report rules, fully implemented in July 2024, revolutionized fund disclosure. Reports now average just three pages, compared to the previous 100-page documents, with simplified expense presentations showing actual dollar costs for a $10,000 investment. These streamlined reports make it easier for individual investors to compare NAV and price returns.
Starting in November 2025, large fund complexes will be required to file monthly portfolio holdings reports, with the data becoming public 60 days after filing. This increased transparency enables investors to understand precisely what drives NAV calculations and identify potential pricing inefficiencies. The elimination of complex “access equals delivery” rules means investors receive clear, direct reporting of both NAV and market performance.
Money market fund reforms implemented in 2024 increased daily liquid asset requirements to 25% and weekly requirements to 50%, reducing the likelihood of NAV deviations during market stress. The removal of redemption gates eliminates one source of panic-driven pricing discrepancies that plagued these funds during previous crises.
The Mutual Fund and ETF Evaluators, which are part of AAII’s A+ Investor, provide an array of performance data for ETFs and mutual funds on both a trailing and annual basis. Morningstar is the mutual fund and ETF data provider for both AAII and A+ Investor.
Only NAV returns are provided for mutual funds since they do not trade like ETFs and do not have a separate market price.
The table below shows the annual total NAV returns for the Vanguard 500 Index fund (VFINX) as of July 31, 2025.

Morningstar’s calculation of total return is determined by taking the change in NAV, reinvesting all income and capital gains distributions during that month and dividing by the starting NAV. Reinvestments are made using the actual reinvestment NAV, and daily payoffs are reinvested on a monthly basis.
Unless otherwise noted, Morningstar does not adjust total returns for sales charges (such as front-end loads, deferred loads and redemption fees), preferring to give a clearer picture of a fund’s performance. The total returns account for management, administrative and 12b-1 fees, as well as other costs deducted from fund assets.
Depending on an investor’s specific cash flows, their total returns may differ from those shown on the Evaluator page. This is because these total returns consider the compounded appreciation and income on the (assumed) reinvested amount.
For ETFs, total returns based on both NAV and price are provided. The table below shows the annual NAV and price returns for the iShares Core S&P 500 ETF (IVV) as of July 31, 2025.
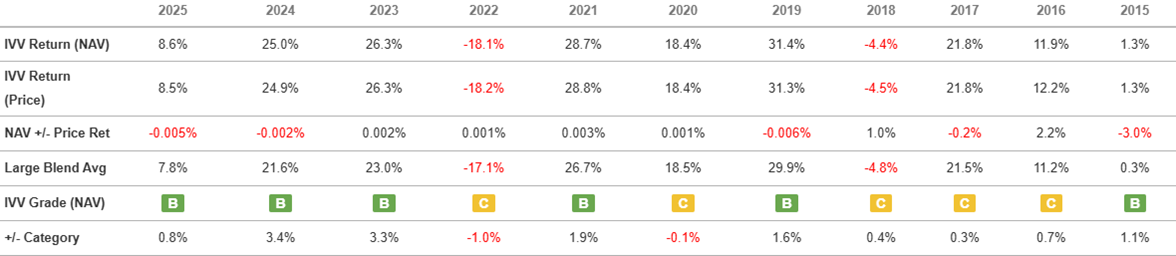
The total price return tracks the change in the market (trading) price of the ETF for the specified period, assuming reinvestment of all income and capital gains distributions during the period.
Don’t be surprised if you see a difference in an ETF’s NAV return and price return. When an ETF makes dividend and capital gains distributions in a period, they are taken out of its assets, lowering the NAV. However, these distributions are still part of the investor’s total return.
Total price return, therefore, gives a more accurate representation of the return that shareholders actually see.
ETFs that trade at significant premiums or discounts to the NAV will see a larger difference between the price return and the NAV return.
Many investors unknowingly hurt their returns by misunderstanding these concepts. The most costly error is using market orders for ETF trades during periods of market volatility. On March 9, 2020, when markets dropped 7% at the open, several popular ETFs gapped down much further than their underlying holdings justified. Investors with market orders lost an additional 2% to 3% beyond the actual market decline.
Another frequent mistake involves comparing funds using the wrong return metric. An international fund might show superior price returns while delivering inferior NAV performance due to persistent premiums. Investors who choose funds based on price returns alone may be selecting funds that are simply overpriced rather than outperforming.
Tax implications create additional complexity. Capital gains and losses for tax purposes depend on your purchase and sale prices, not NAV performance. An ETF bought at a 2% discount and sold at the NAV generates a 2% short-term gain, even if the underlying holdings remained flat. Many investors miss these tax-optimization opportunities by focusing solely on NAV returns.
Timing also matters more than most realize. ETF spreads typically widen at market open and close due to uncertainty about overnight news and final settlement prices. Placing trades mid-morning or mid-afternoon often results in better execution, saving five to 10 bps on typical transactions.
Here are some guidelines for managing NAV versus price considerations.
Modern tools make monitoring these metrics easier than ever. Many brokerage platforms now display real-time premiums and discounts, while fund comparison tools show both return types for informed decision-making. Asset-weighted expense ratios have dropped to 0.34% industry-wide in 2025, but investors who ignore pricing dynamics may forfeit these savings through poor execution.
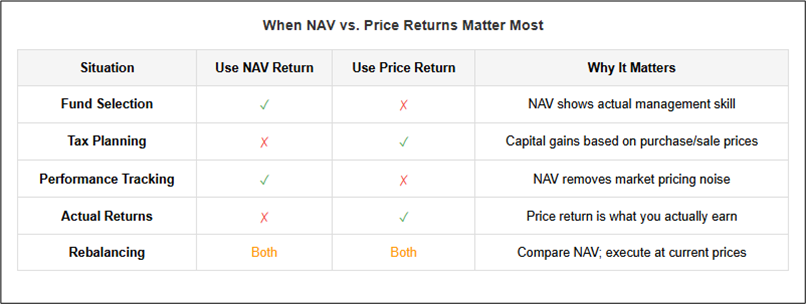
Understanding when to prioritize NAV versus price returns can significantly impact investment outcomes.
The distinction between NAV and price returns represents more than technical minutiae—it’s fundamental to making informed investment decisions. As markets become more volatile and fund structures become more complex, understanding these concepts helps investors avoid costly mistakes while capitalizing on occasional inefficiencies. The SEC’s enhanced disclosure requirements and declining expense ratios create an environment where informed investors can achieve better outcomes, but only if they understand what they’re actually buying and selling.
Individual investors should focus on NAV returns for performance evaluation and fund selection while monitoring price returns for execution and tax planning. Using limit orders, avoiding market open and close periods, and understanding your fund’s typical premium or discount patterns can meaningfully improve long-term returns. With average expense ratios at historic lows, the difference between smart and poor execution may exceed the cost savings from choosing cheaper funds. Master these concepts, and you’ll join the minority of investors who truly understand what drives their returns.

