My A+ Investor Toolkit Dashboard
A+ Investor subscribers have access to the My A+ Investor Dashboard, a personalized section of AAII.com that brings many of the key elements of A+ Investor into a single page. Monitor your investments, discover new opportunities and learn what strategies work (or don’t work).
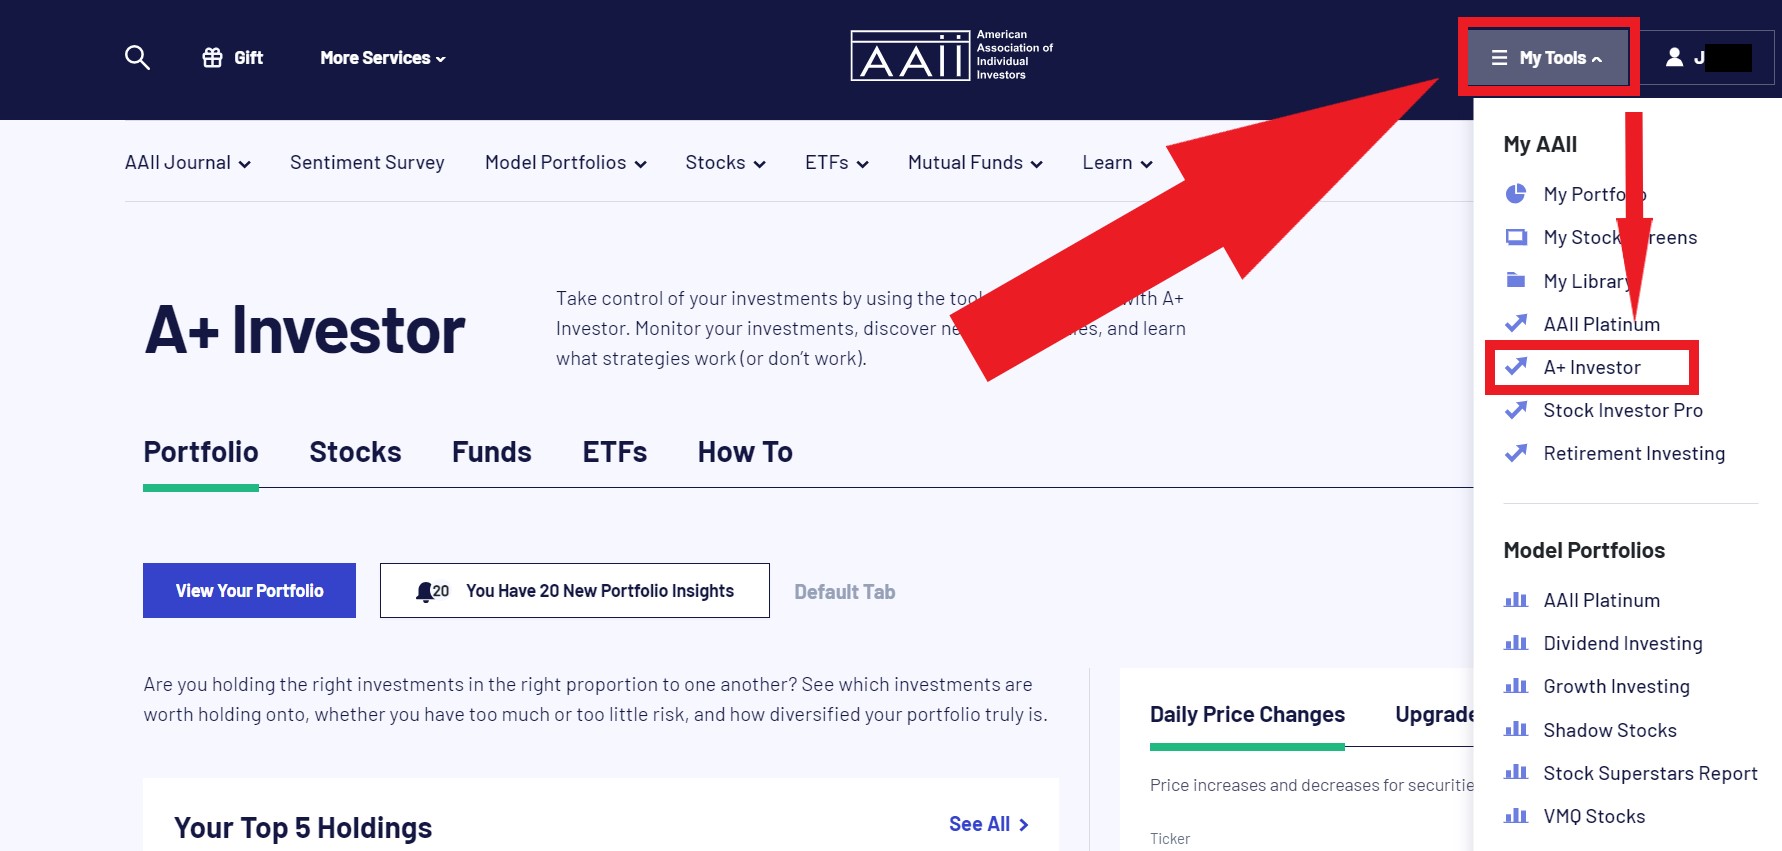
Access the A+ Investor Dashboard by clicking on My Tools at the top-right of the AAII.com home page and choosing A+ Investor from the drop-down list.
The dashboard presents relevant news from the portfolio that you have favorited in My Portfolio and tips to get more out the portfolio tracker. If you have starred a stock, fund or ETF portfolio in My Portfolio as favorite, the Inights button shows the number of new insights for the securities in that portfolio.
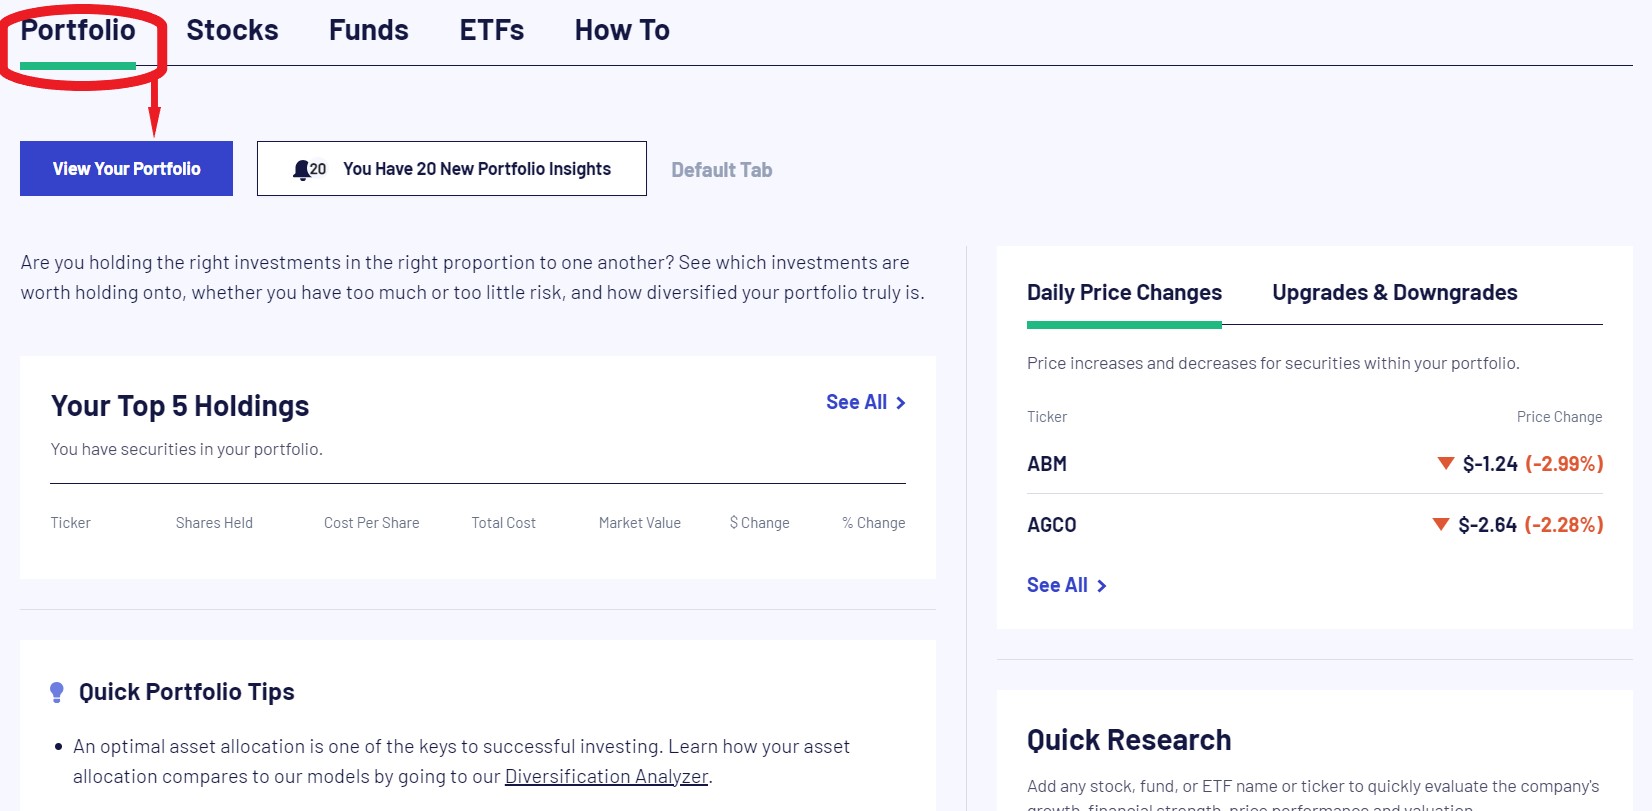
For more guidance on using the portfolio tracker, see the My Portfolio User Guide.
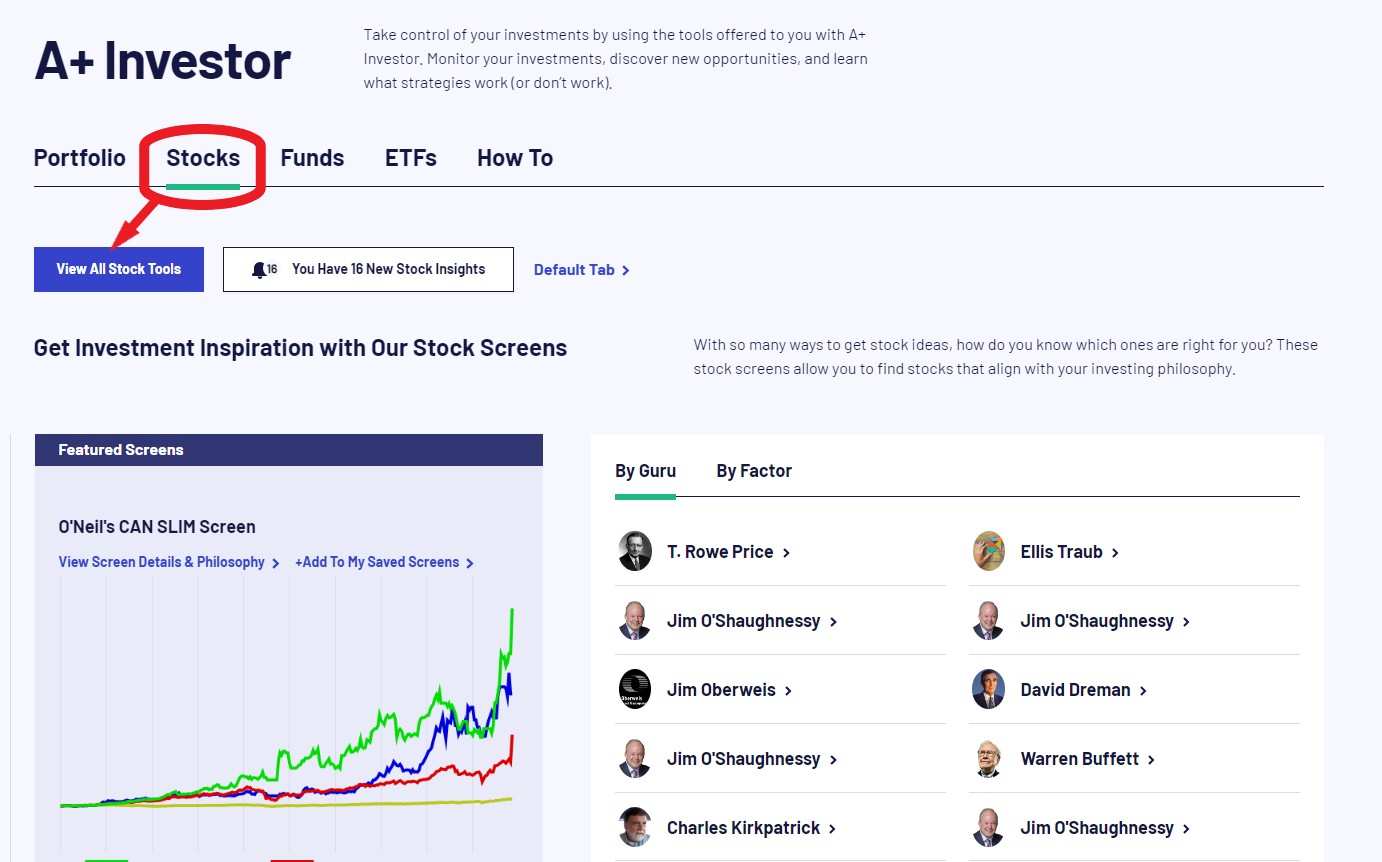
Clicking on Stocks from the A+ Investor Dashboard directs you to stock ideas that may interest you. If you have starred a stock portfolio in My Portfolio as favorite, the Insights button shows the number of new insights for stocks in that portfolio.
For our full complement of tools and resources for stock investors, go to our Stocks area by clicking on the blue View All Stock Tools button:
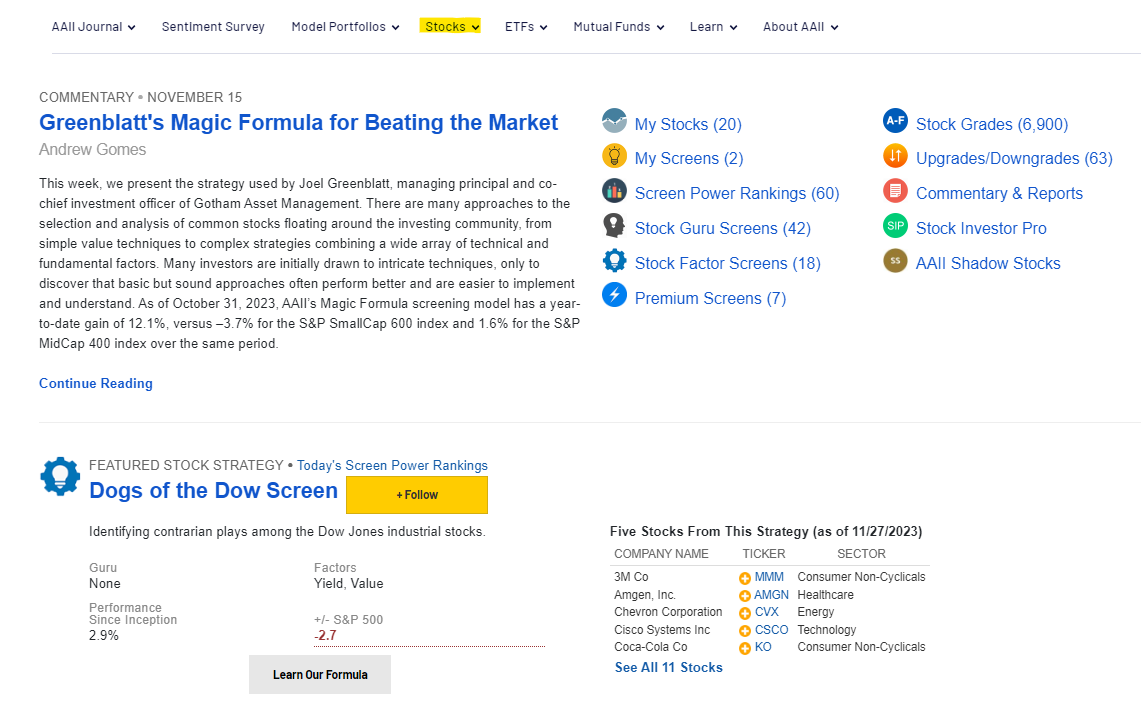
Also highlighted on the Stocks page: the Featured Member Strategy, which displays AAII’s Model Shadow Stock Portfolio information including five stocks with the lowest price-to-book ratio and the portfolio’s latest alerts; and a Premium Strategy, which highlights one of AAII’s premium model portfolios (Dividend Investing, Growth Investing, Stock Superstars Report, VMQ Stocks) and five top stocks from the portfolio. Select See All Premium Screens for a similar sample of each approach.
The A+ Stock Grades table displays grades across all factors as of the last trading day. This information is presented in two tabs: Top Graded Stocks (B or better) and Bottom Graded Stocks (D or worse).
The A+ Stock Upgrades & Downgrades table displays stocks with at least two upgrades or downgrades across all factors, with data as of the last trading day compared to the previous trading day. This information is presented on two tabs: Upgrades and Downgrades.
Clicking on Funds from the A+ Investor Dashboard directs you to mutual fund ideas that may interest you. If you have starred a mutual fund portfolio in My Portfolio as favorite, the Inights button shows the number of new insights for the funds in that portfolio.
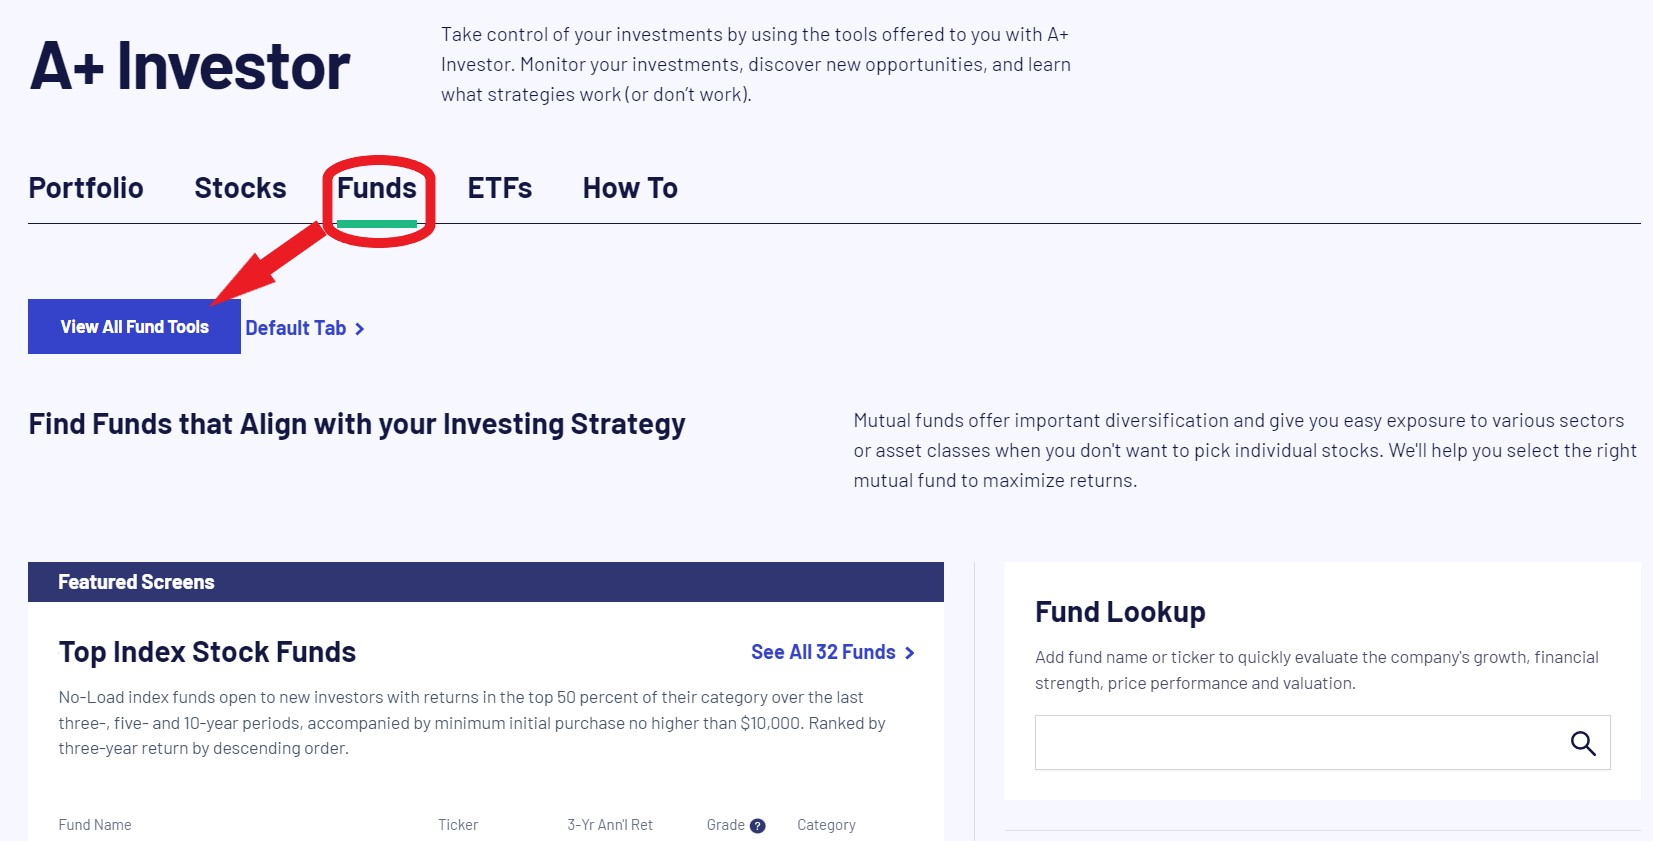
For our full complement of tools and resources for mutual fund investors, go to our Funds area by clicking on the blue View All Fund Tools button:
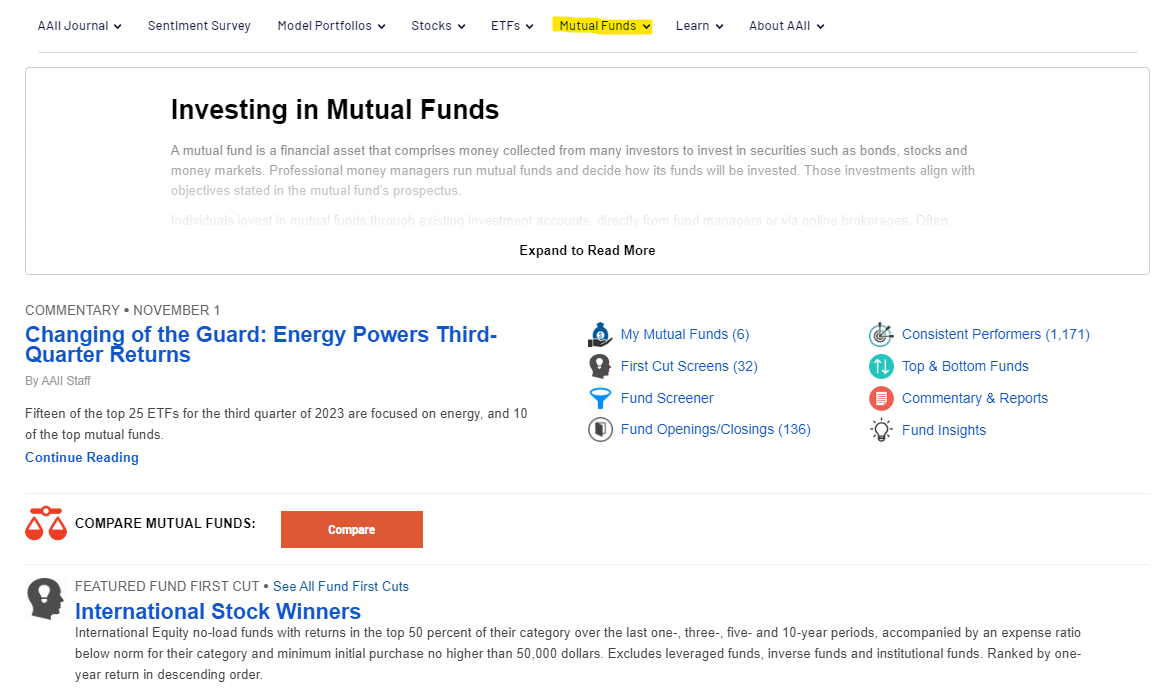
At the right side of the page, you will find several links that offer direct access to mutual fund screeners, screening strategies, mutual fund data and information and mutual fund commentary and reports. In addition, there is a mutual fund comparison tool.
The Mutual Fund Screener is built exclusively for A+ Investor subscribers.
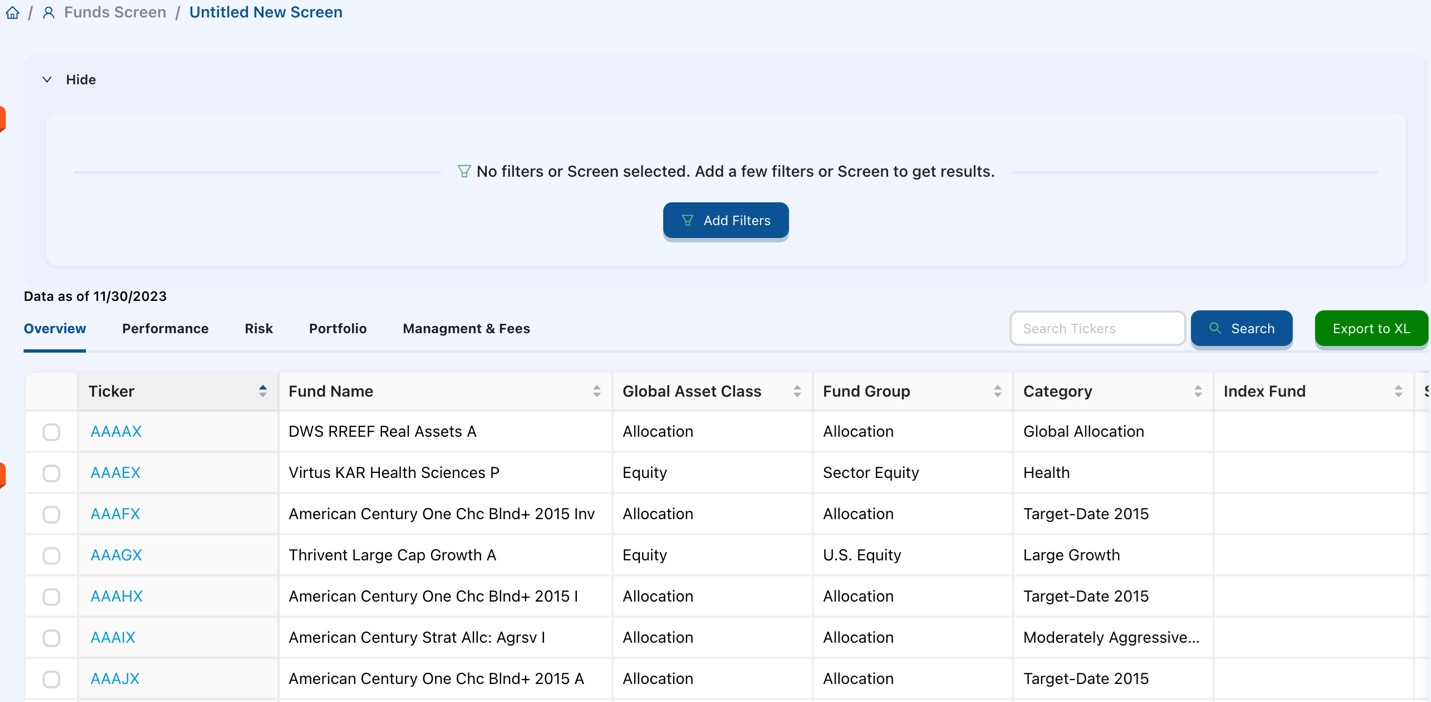
The Mutual Fund Screener allows you to:
The Mutual Fund Screener’s filters are divided into several categories:
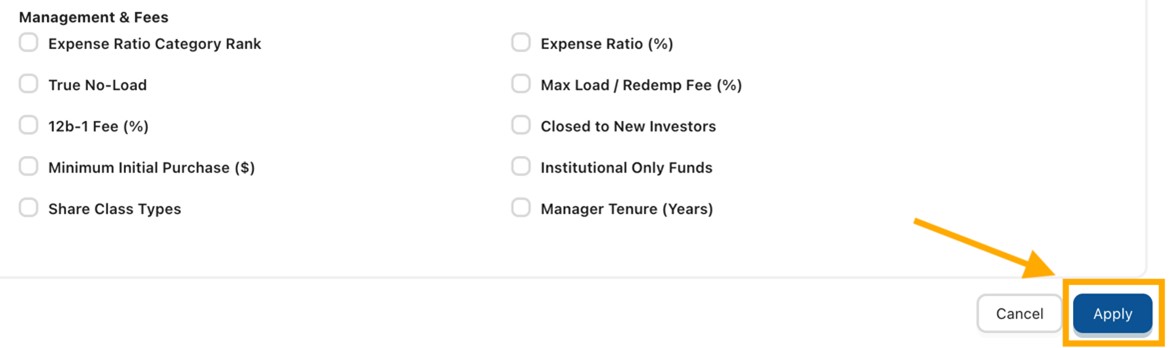
To build a screen, click on the Add Filters button in the main section of the screener. Then simply select the criteria you want to include in your screen and click on the blue Apply button located in the bottom-right corner of the pop-up filters window.
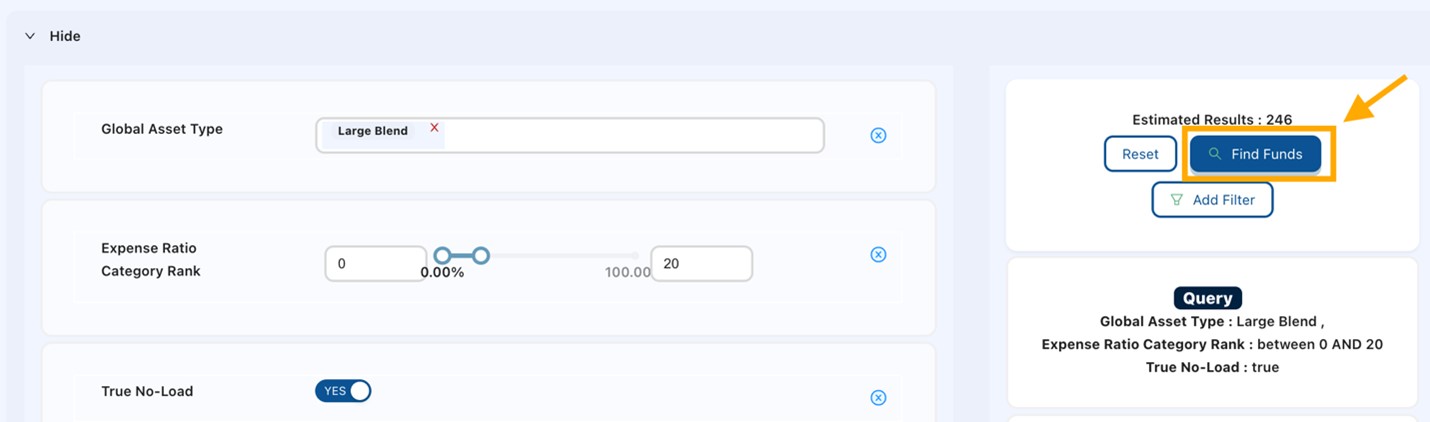
You can then adjust the filters to specific criteria. In the example below, we are looking for no-load (toggling the True No Load button to Yes), large-cap blend funds (removing all but the Large Blend category) with low expense ratios (setting Expense Ratio Category Rank range to 0% to 20%). Clicking on the blue Find Funds button will call up the funds matching your criteria.
You can save mutual fund screens that you have created by clicking the Save Screen link in the menu on the left. You can access screens you have saved from the menu bar by clicking on Load Saved Screens.
Once you have loaded a screen (from the predefined screens list or from your list of saved screens), you can modify it and save it. Predefined screens can be saved under a different name (they cannot be overwritten). Screens you create yourself can either be overwritten or saved under a different name.
We have created more than 30 predefined mutual fund screens, which you can access from the Predefined Screens drop-down menu. These predefined screens include:
Selecting a screen from this list will load the criteria. Click on the Find Funds button on the far right to load the passing funds, which show up in the table below the criteria. If you want to remove a filter, click on the blue circled “x” located to the right of the criterion. Then click the Find Funds button again to update the list of passing mutual funds, as well as click on Save Screen in the left-hand menu. You cannot overwrite a predefined screen, but you can give it a new name, at which point it will be available in My Saved Screens on the left side.
You can rename, delete and add/revise a description for any of your personal mutual fund screens by Manage Saved Fund Screens in the left-hand menu. After the screen loads, click on Save Screen from the left-hand menu, change the Screen Name or Description and then click the Save button to retain those changes.
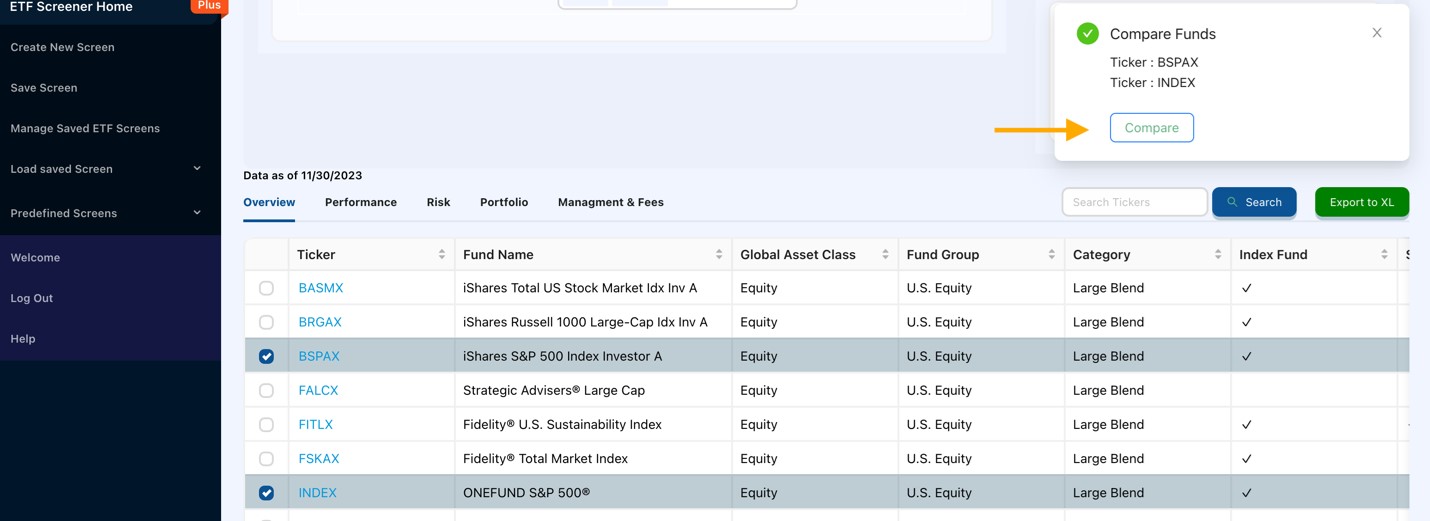
Lastly, you can compare multiple mutual funds that pass a given screen. In the left-most column of the results table, click on the check boxes next to those funds you wish to compare, and then click on the Compare button in the Compare Funds box that pops up on the right.
In this example, three different small-cap growth mutual funds are compared:
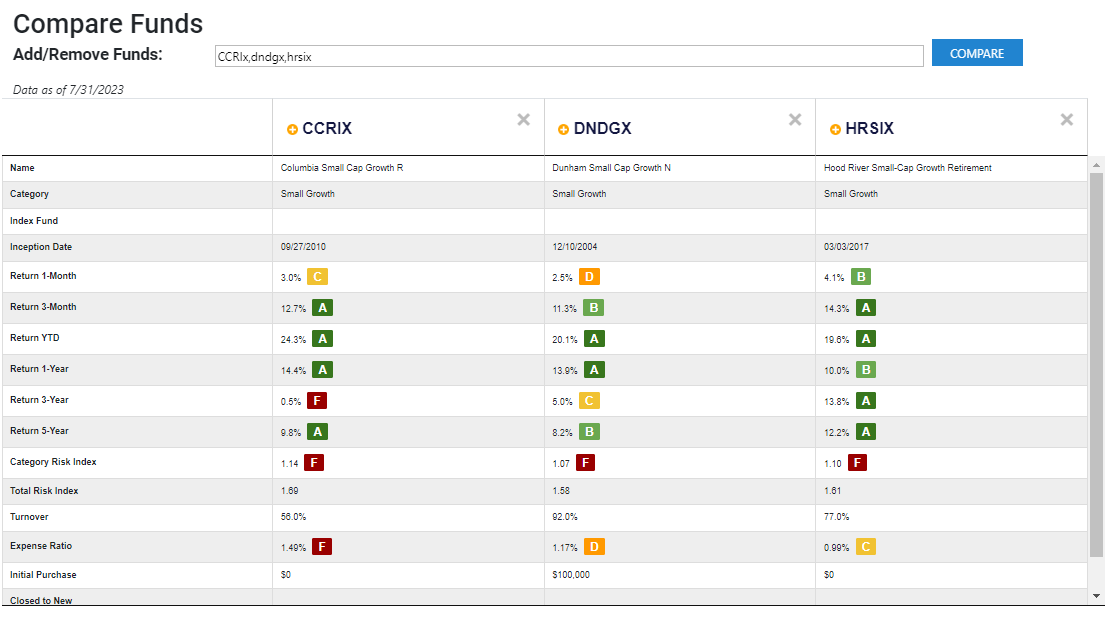
From the comparison table, you can also add a mutual fund to an existing portfolio/watchlist.
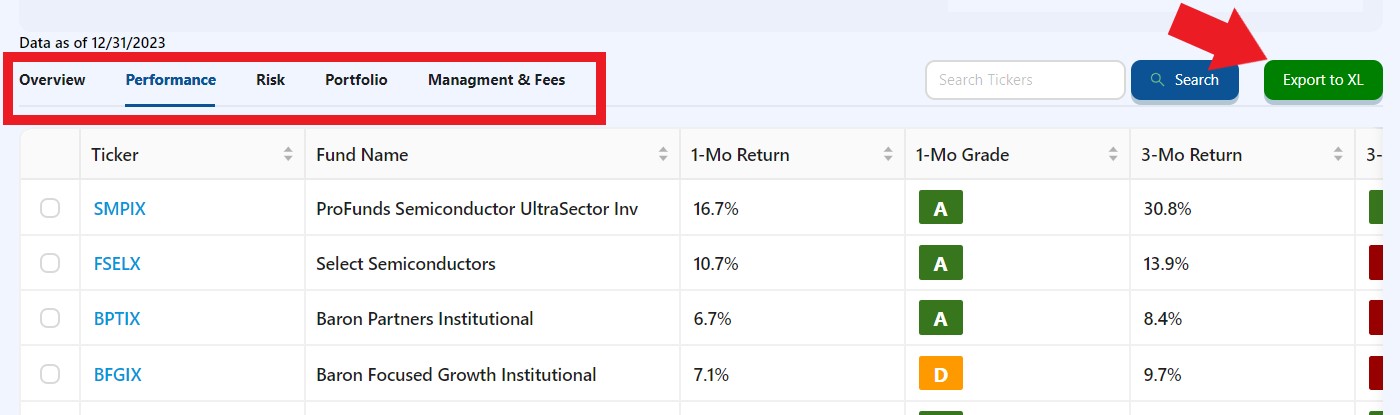
Looking at the results of the screen you’ve applied, the data is divided into several tabs for easier viewing. An Export to Excel button is also provided if you wish to download the screen results for analyzing offline.
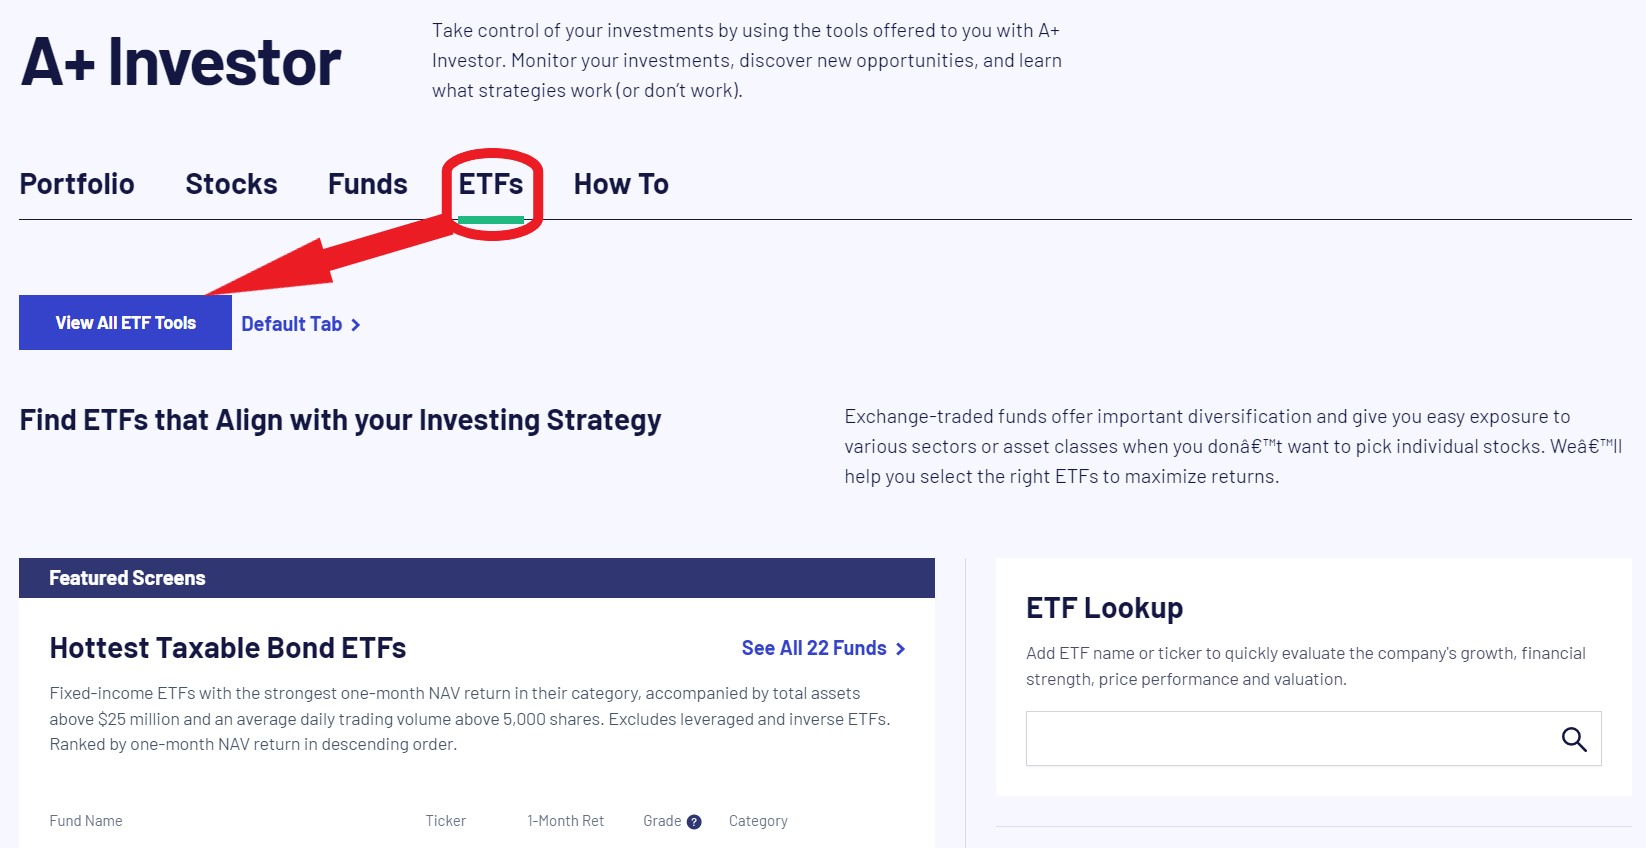
Clicking on ETFs from the A+ Investor Dashboard directs you to ideas on exchange-traded funds that may interest you. If you have starred an ETF portfolio in My Portfolio as favorite, the Inights button shows the number of new insights for the ETFs in that portfolio.
For our full complement of tools and resources for ETF investors, go to our ETFs area by clicking on the blue View All ETF Tools button:
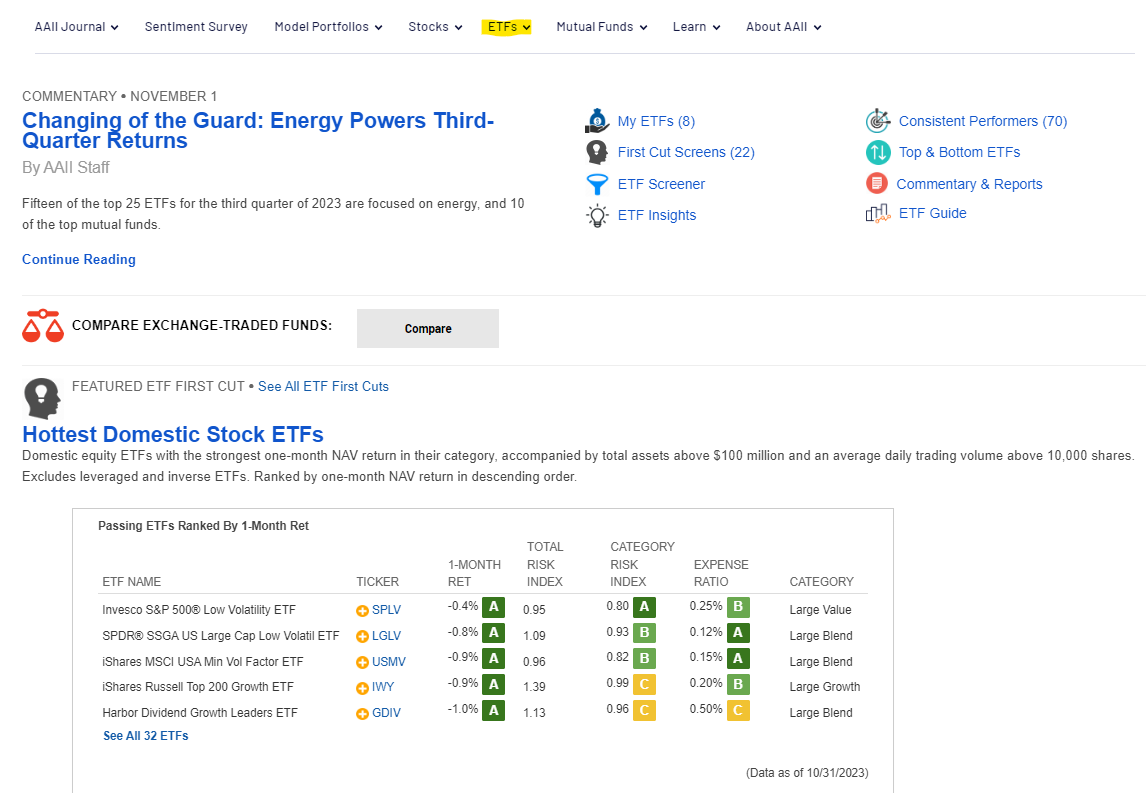
At the upper-right side of the ETFs page, you will find several icons that offer direct access to ETF screeners, screening strategies, ETF data and information and ETF commentary and reports. In addition, there is an ETF comparison tool.
The ETF Screener is built exclusively for A+ Investor subscribers.
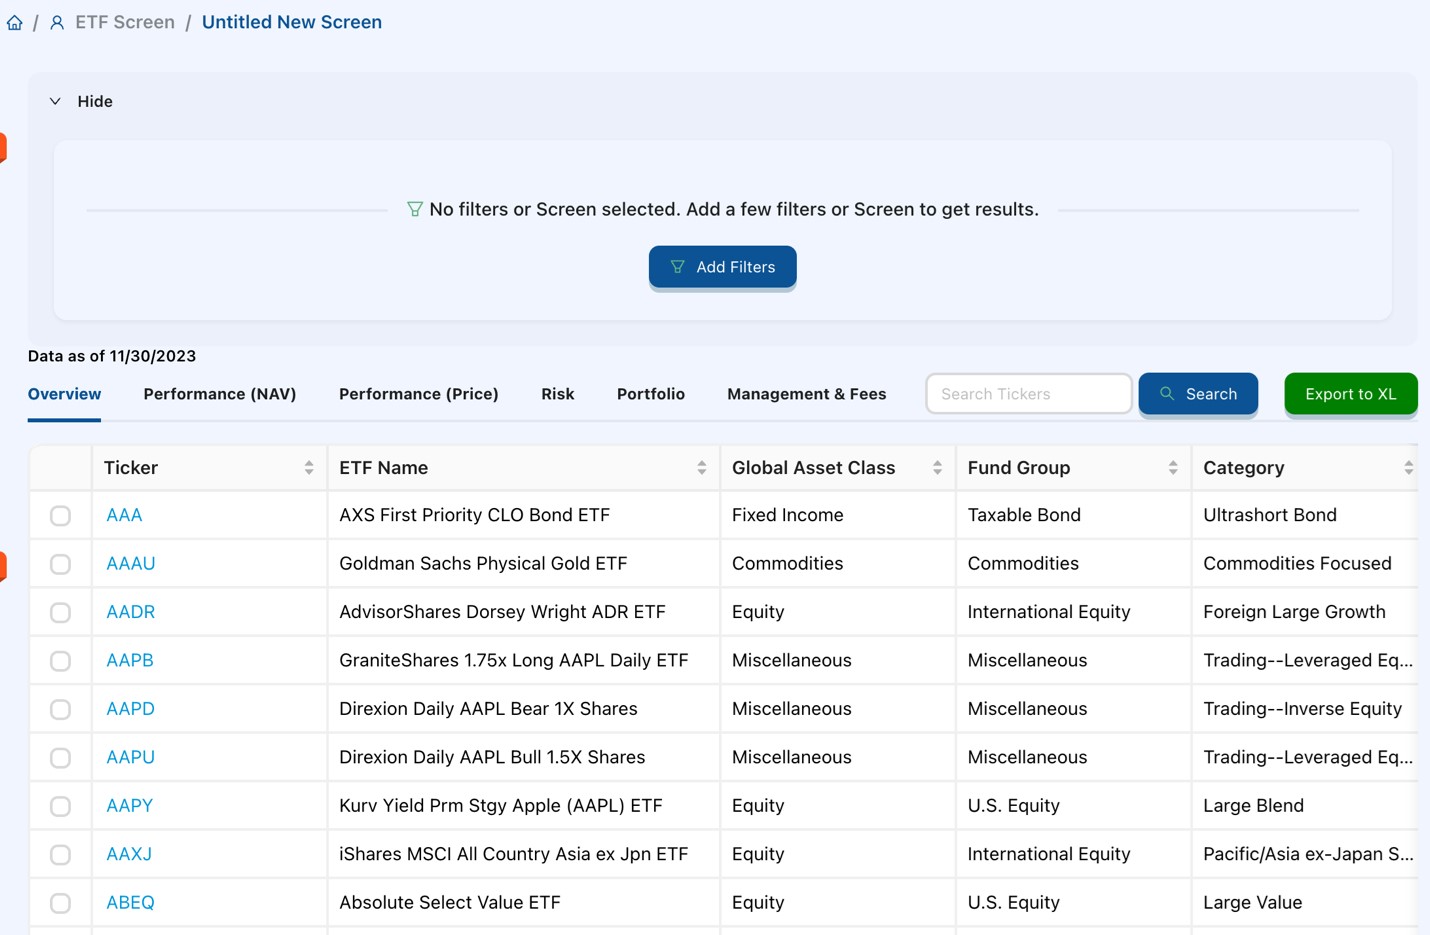
The ETF screener allows you to:
The ETF screener’s filters are divided into several categories:
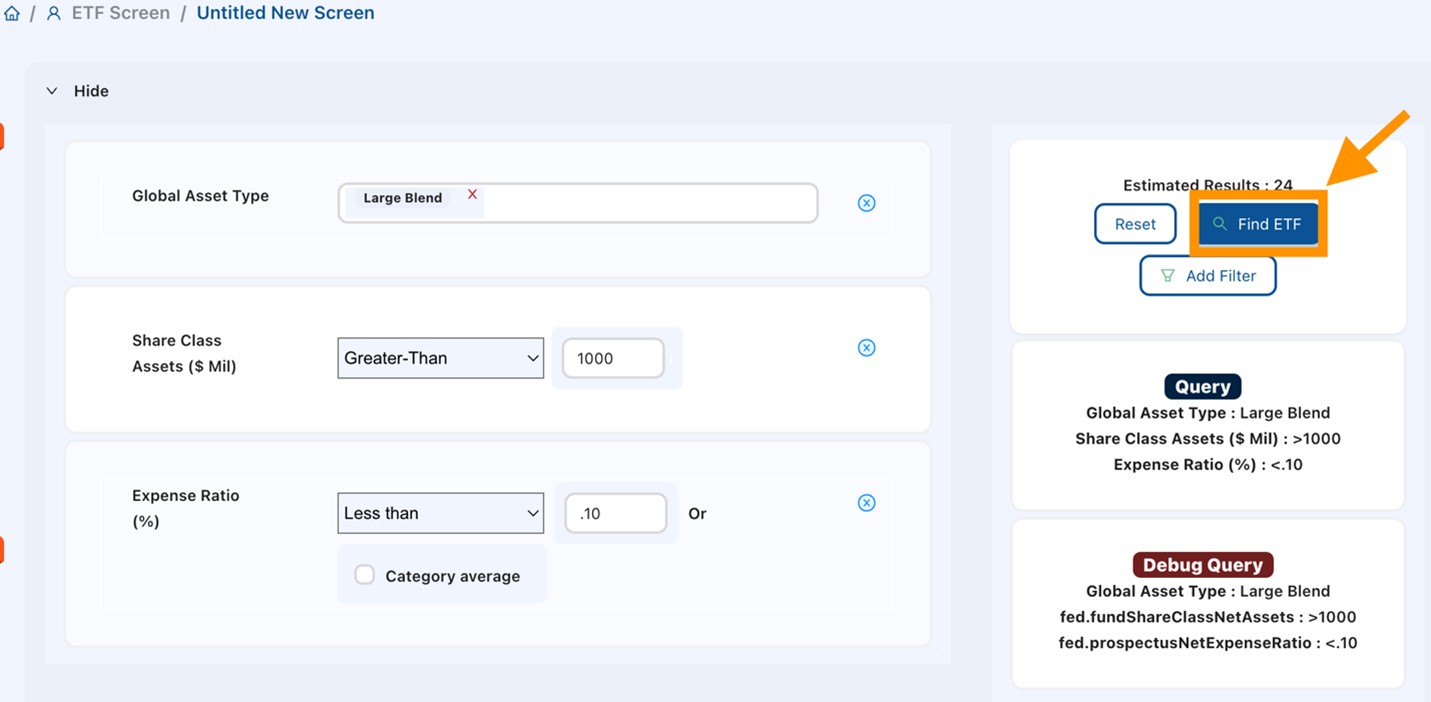
You can then adjust the filters to specific criteria. In this example below, we are looking for large-cap blend ETFs (removing all but the Large Blend category) with more than $1 billion in total assets (setting Share Class Assets to greater than $1,000 million) and very low expense ratios (setting Expense Ratio Category Rank range to 0% to 20%). Clicking on the blue Find ETF button will call up the ETFs matching your criteria.
We have also created 22 predefined ETF screens, which you can access from the Predefined Screens drop-down menu. These predefined screens include:
Selecting a screen from this list will load the criteria. Click on the Find ETF button on the far right to load the passing ETFs, which show up in the table below the criteria. If you want to remove a filter, click on the blue circled “x” located to the right of the criterion. Then click the Find ETF button again to update the list of passing ETFs, as well as click on Save Screen in the left-hand menu. You cannot overwrite a predefined screen, but you can name it using a new name, at which point it will be available in My Saved Screens on the left side.
You can rename, delete and add/revise a description for any of your personal ETF screens by clicking on Manage Saved Fund Screens in the left-hand menu. After the screen loads, click on Save Screen from the left-hand menu, change the Screen Name or Description and then click the Save button to retain those changes.
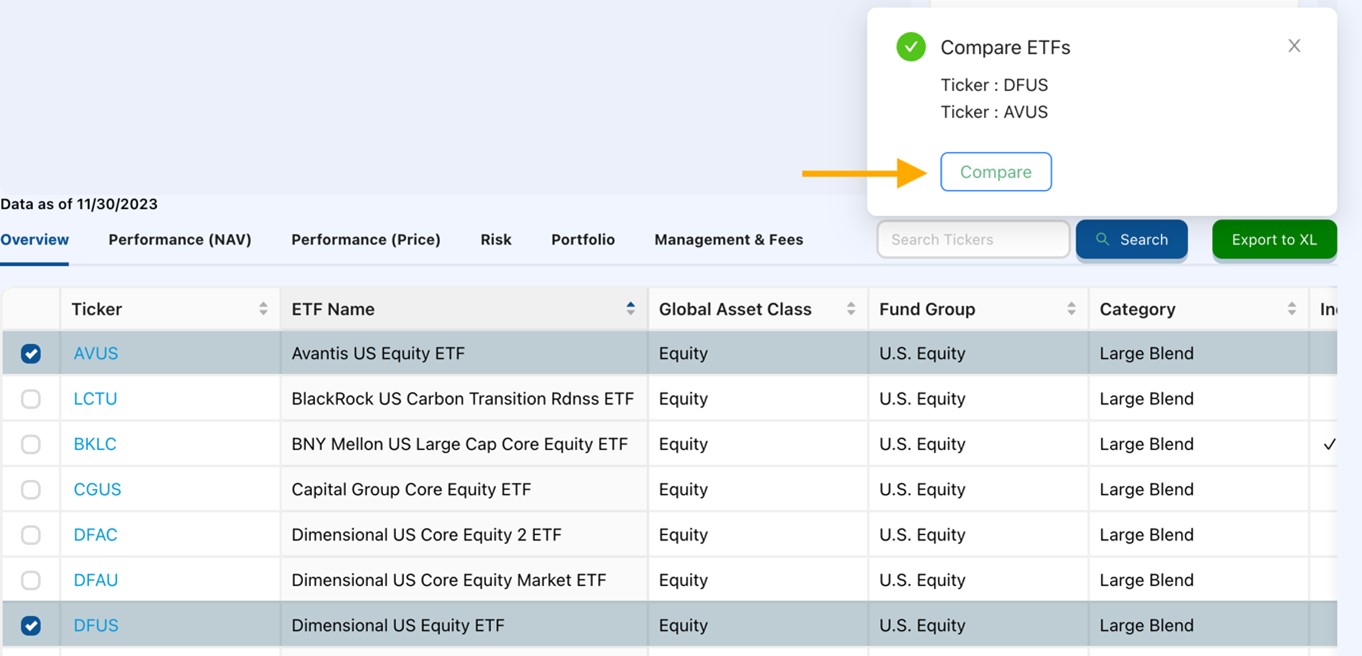
Lastly, you can compare multiple ETFs that pass a given screen. In the left-most column of the results table, click on the check boxes next to those ETFs you wish to compare, and then click on the Compare button in the Compare Funds box that pops up on the right.
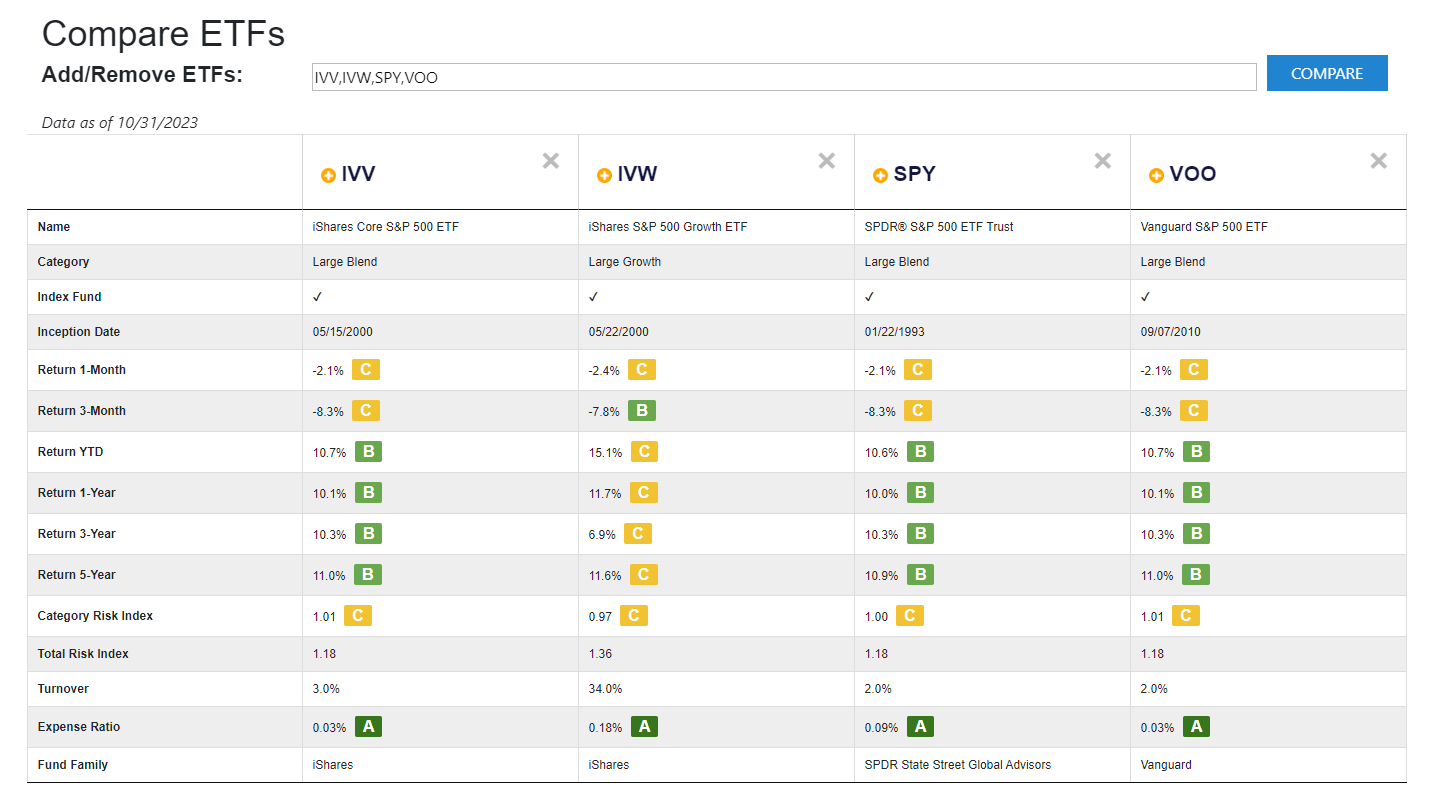
For this example, four different S&P 500 index ETFs are compared. The comparison grid shows category, inception date, performance data for a number of time periods, category risk, turnover and expense ratio.
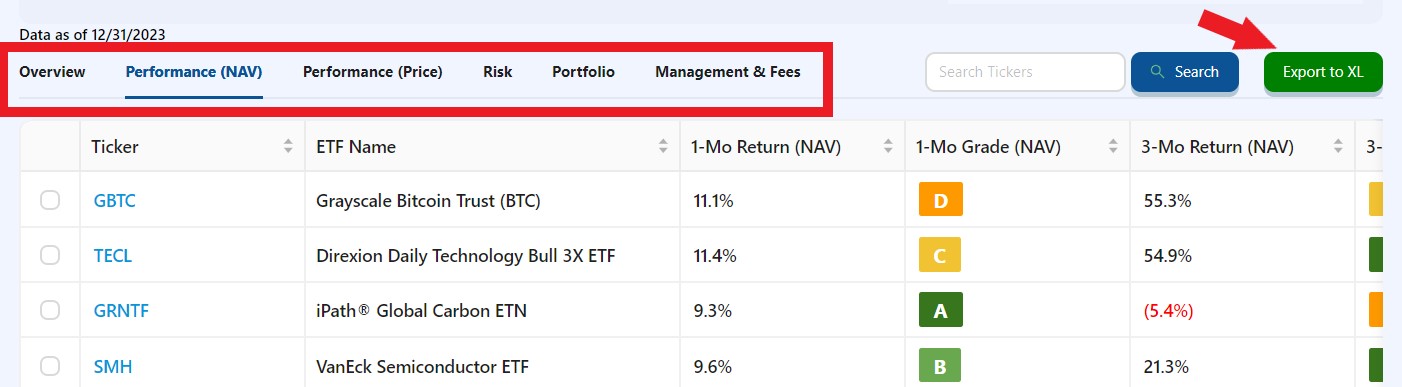
Looking at the results of the screen you’ve applied, the data is divided into several tabs for easier viewing. An Export to Excel button is also provided if you wish to download the screen results for analyzing offline.
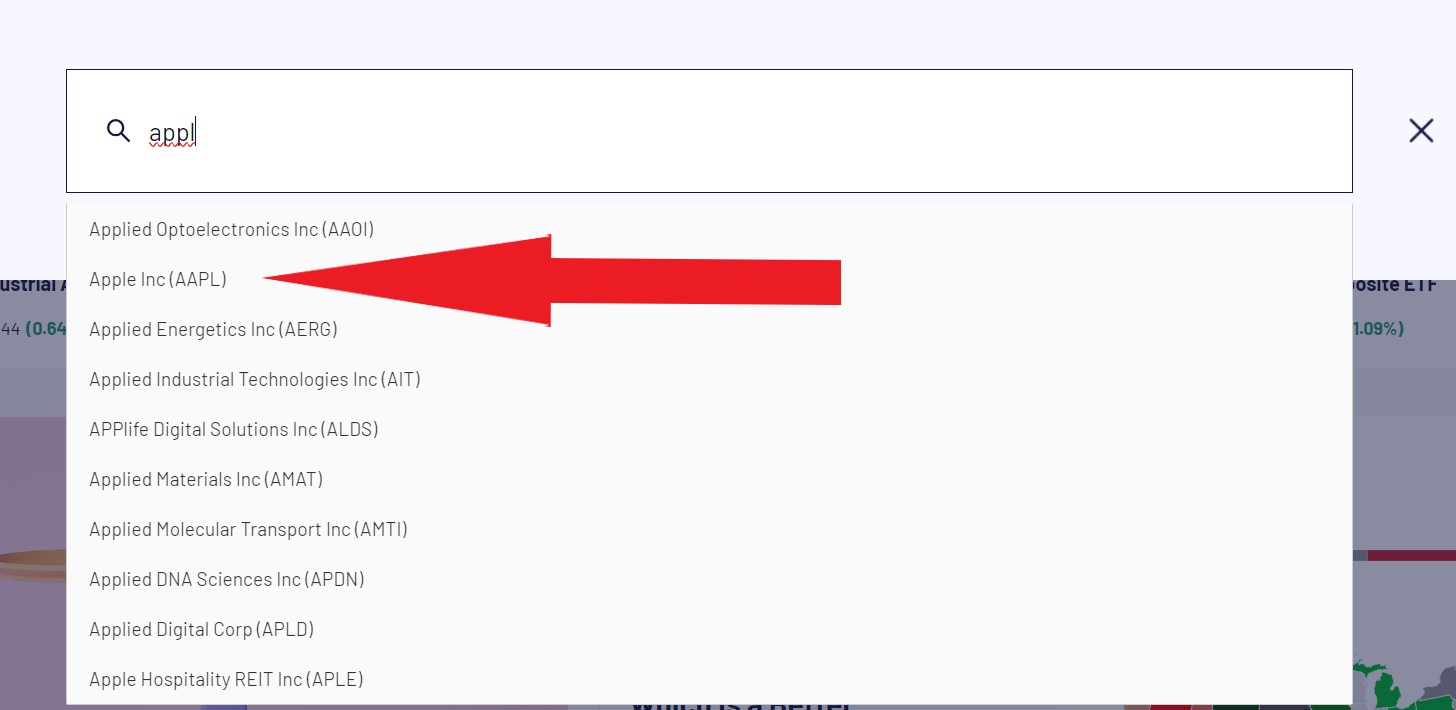
AAII offers an Evaluator for any stock, mutual fund or ETF in our universe that presents an abundance of data and information on individual securities. To access the Evaluator, click on the Search (magnifying glass icon) in the upper-left corner of any AAII.com page.

Type the security’s ticker or name in the search box that appears. For example, if you wished to analyze Apple Inc. (AAPL), start by typing the company name and when you see the stock in the drop-down list, select it.
When you select your stock from the search list, you will first arrive at the Snapshot tab, where select company and industry data will be displayed to give you an overview of the company’s growth, financial strength, price performance and valuation.
A+ Investor subscribers can take a deeper dive on the remaining Stock Evaluator tabs, including the Grades, Charts, News & Events, Valuation, Growth, Ratios, Analysts (analyst ratings), Earnings (consensus estimate data), Financials (detailed quarterly and annual financial statement data) and Insiders (insider buy and sell activity) tabs.
Stock data is updated every 15 minutes throughout the trading day.
A+ Grades for Stocks
The new A+ Stock Grades system is a stock-grading tool based on percentile rankings of multiple key metrics within five factors: value, growth, momentum, estimate revisions and quality. They represent a summary of a company’s fundamentals and give you a quick overview of how a stock rates based on five investment factors that have been shown to produce market-beating results.
Not only do you get a letter grade for each of the five factors, but you can also see the percentile rankings of the underlying data points for each grade. Also, we provide main competitors and their letter grades. These grades are calculated and updated daily.
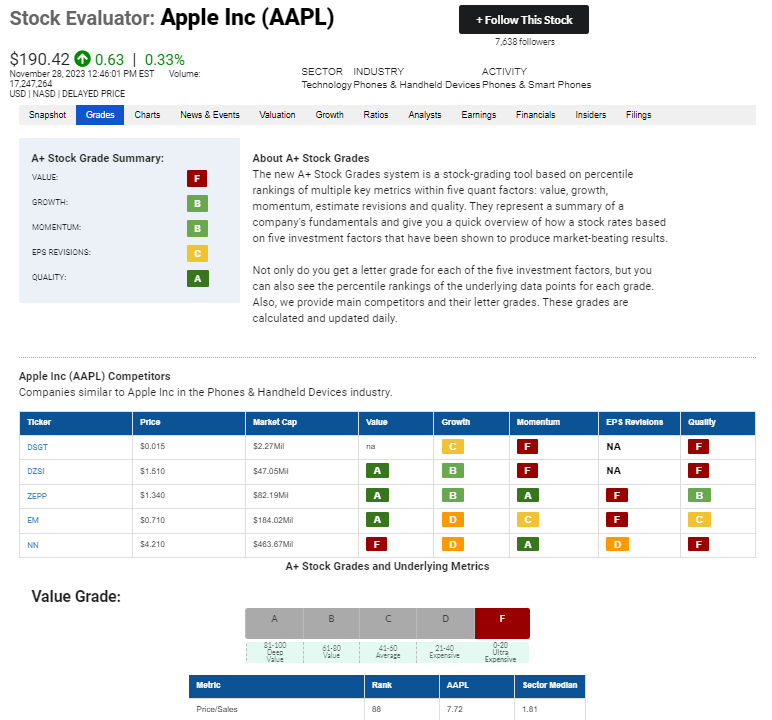
For stocks, there are A+ Grades for roughly 6,600 companies.
Entering in a mutual fund or ETF ticker into the Search box will take you to the corresponding fund or ETF Evaluator. When you first enter a mutual fund or ETF symbol, you will land on the Overview summary tab that provides an overview of the fund or ETF, with a full complement of performance data and portfolio information.
Mutual fund and ETF data is updated monthly.
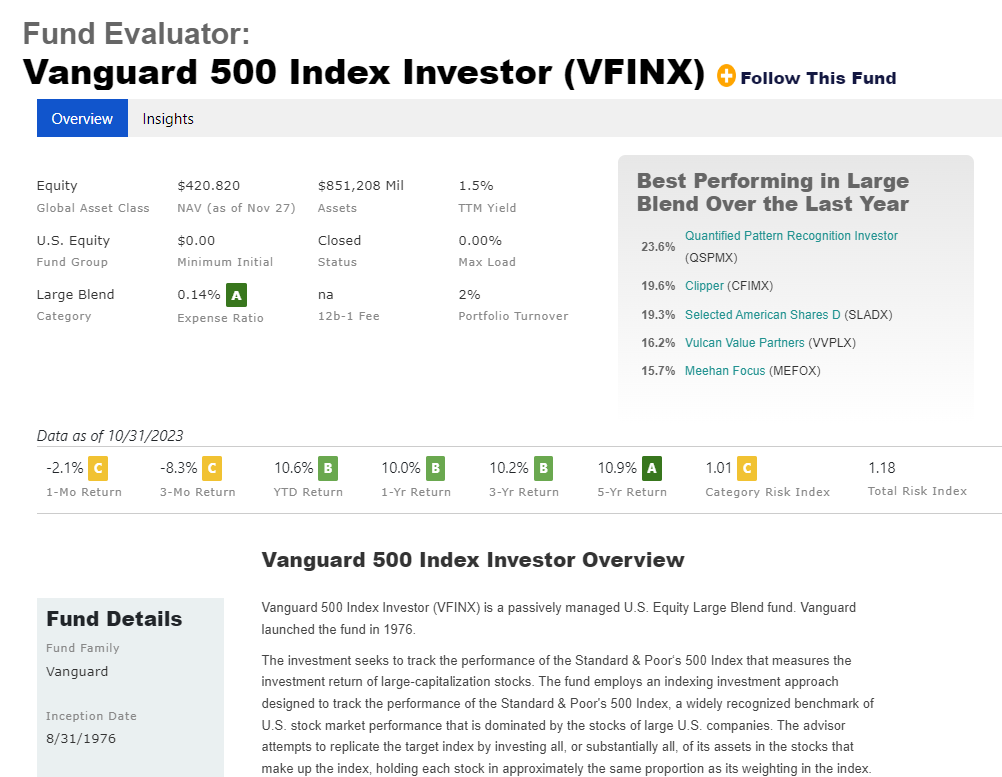
A+ Grades for Funds and ETFs
The letter grades for funds and ETFs are calculated by segmenting the funds in the respective mutual fund and ETF categories into quintiles (20% increments) and then assigning an A grade for funds or ETFs (or their overall categories) that rank in the top 20% for any performance-related fields and in the bottom 20% for any risk and expense fields.
Note that the grades refer to a fund’s or ETF’s ranking within its category, which makes for better apples-to-apples comparisons.
With the A+ Stock Grades Screener, you can identify stocks with specific letter grades across the A+ factors of value, growth, momentum, estimate revisions and quality. To access the new A+ Stock Grades Screener, go to https://www.aaii.com/stockideas/quant.
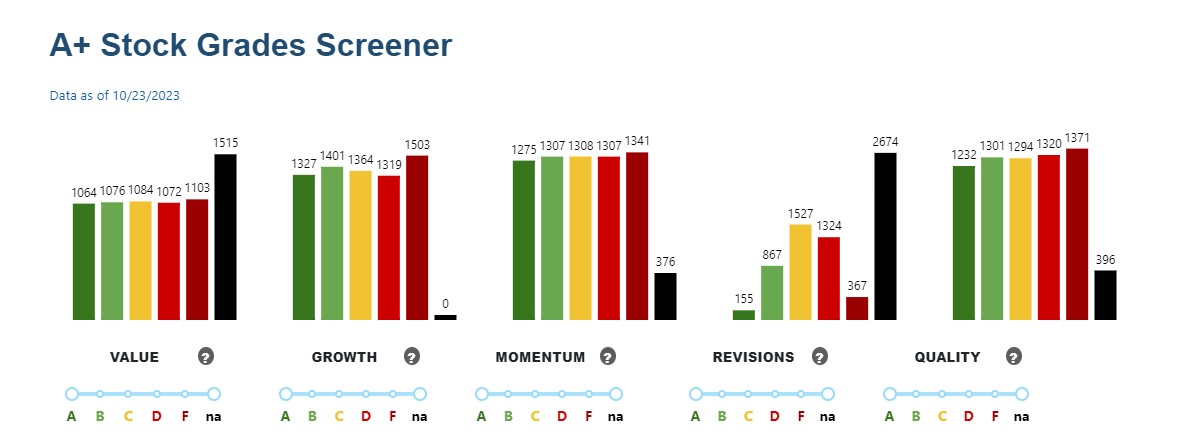
There are roughly 6,600 companies in the A+ Investor stock universe and you can see how many stocks have a specific letter grade across the five A+ Ratings factors: value, growth, momentum, revisions and quality. In the example above, 1,064 companies have an “A” letter grade for Value.
For each factor, there are sliders that you can use to limit the grade for that particular factor.
Looking for stocks in the database with letter grades of A for Value and Momentum and letter grades no worse than B for Growth, Revisions and Quality led to 19 companies:
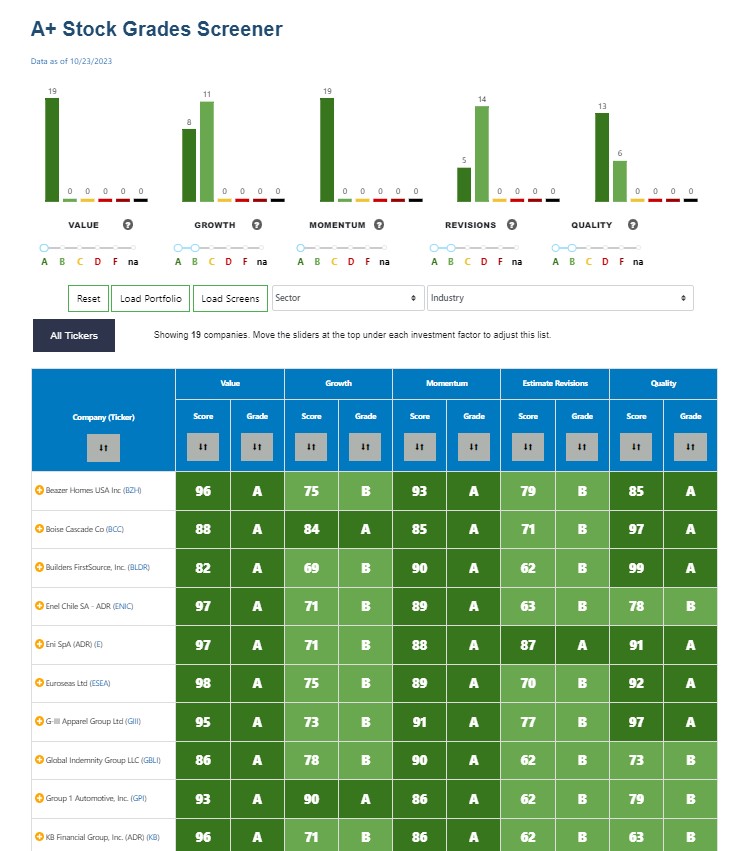
You can rank the table of passing companies by company name as well as each factor’s letter grade.
Clicking on the ticker of a passing company takes you to the Stock Evaluator for that ticker.

